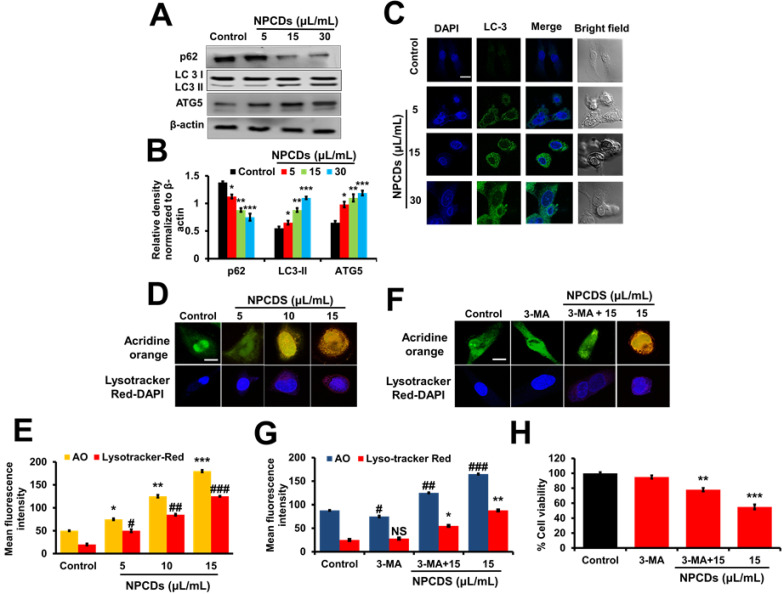
Figure 8.
Effect of nitrogen-/phosphorous-doped carbon dots on autophagy markers. (A) Western blot analysis of various autophagy markers (LC3, ATG-5, and p62) and (B) ImageJ analysis of B16F10 melanoma cancer cells after treatment with nitrogen-/phosphorous-doped carbon dots (NPCDs; 0-30 μL/mL). (C) Immunocytochemistry of prominent autophagy marker LC3 after treatment with NPCDs evaluated via confocal microscopy. (D) Autophagic vacuole formation after treatment with NPCDs detected via confocal microscopy. (E) ImageJ analysis of autophagic vacuole formation. (F and G) Validation of autophagic vacuole formation evaluated in the presence of 3-methyladenine ((3-MA) preincubated with 2.5 mM for 1 h and then incubated with NPCDs for 24h). The data are represented as the mean ± standard deviation (SD) of three independent experiments: ***P < 0.001, **P < 0.01, * P < 0.05 vs. the control; ###P < 0.001, ##P < 0.01, # P < 0.05 vs. the control.

