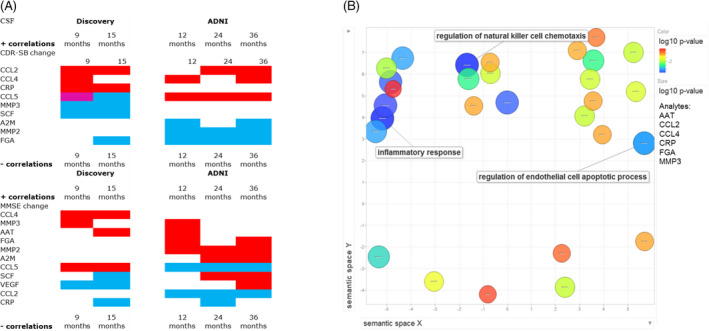
Figure 2.

(A) Heat map denoting significant analytes from ADNI and Discovery datasets in the CSF from the subgroup synergistic analysis correlated to cognitive change (CDR‐SB or MMSE) for 9,12,15,24, and 36 months. Red: positive correlation, Blue: negative correlation, Magenta: has representation in both positive and negative correlation network of analytes. Given that higher CDR‐SB is worse cognition and function while lower MMSE is worse cognition, a positive correlation in CDR‐SB relates to worsening cognition while the negative MMSE correlations relates to worsening cognition. (B) Abundance of Gene Ontology (GO) terms related to biological processes that enrich for key shared analytes between ADNI and Discovery datasets in the CSF in relation to cognitive change (CDR‐SB or MMSE). Analytes included: AAT, CCl2, CCL4, CRP, FGA, and MMP3. GO term most representative of each cluster is noted.
