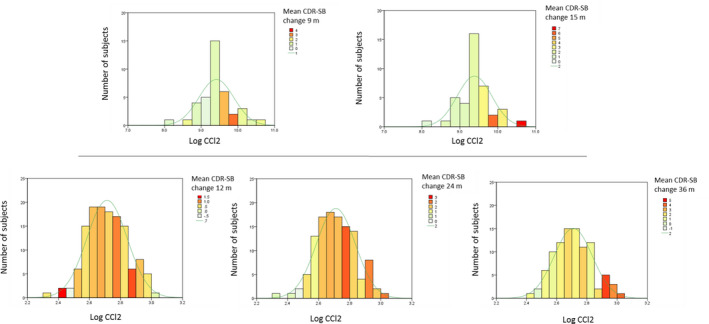
Figure 4.

Histogram with normal distribution score of baseline CSF CCL2 levels, in relation to longitudinal CDR‐SB change (in heat colors) and average CDR‐SB change of cohort at each time point (as a line in legend). Data from Discovery cohort (9 and 15 months), ADNI (12, 24 and 36 months).
