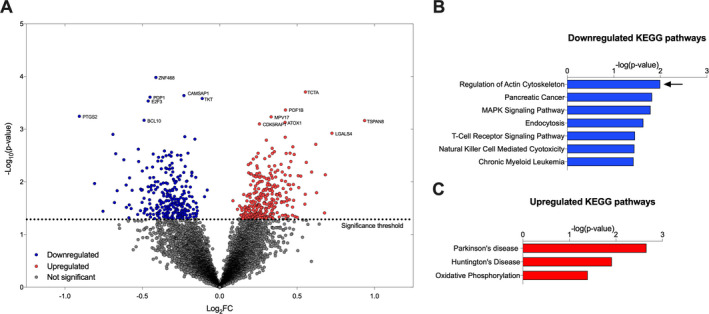
Figure 1.

Transcriptomic analysis in SMA type 3 patients and healthy controls. (A) Volcano plot of 10,174 genes in L1000 experiment. Downregulated (blue) and upregulated (red) genes were selected for GSEA using a simple cutoff at P ≤ 0.05. GSEA reports (B) seven significantly downregulated and (C) three significantly upregulated KEGG pathways in SMA type 3 patients compared to healthy controls. Regulation of Actin Cytoskeleton was the most significantly downregulated pathway
