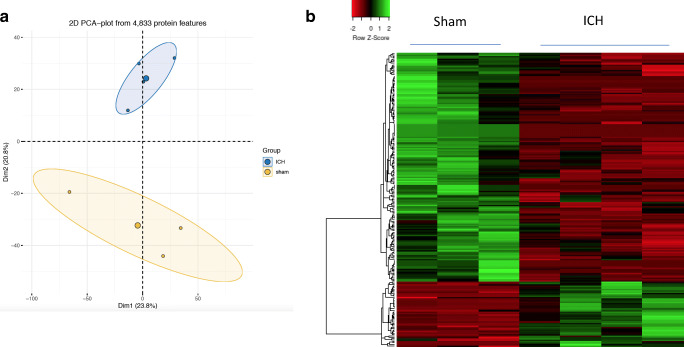
Fig. 2.
The principal component analysis was performed with normalized PSM counts of proteins identified by mass spectrometry using the statistical computing software R and it illustrates that the replicates in each experimental group (sham/ICH) are closely clustered (a). Heatmap representation of differentially expressed proteins between sham and ICH (b). The heatmap was generated with normalized PSM counts of differentially expressed proteins using a web server, heatmapper available at http://www.heatmapper.ca using the distance function (pearson) and clustering (average linkage). Forty-six proteins were significantly upregulated and 161 proteins were significantly downregulated after ICH in comparison to sham. Green: high expression, and red: low expression. n = 3–4 animals/group. The complete list of differentially expressed proteins is provided as supplementary data Table 1

