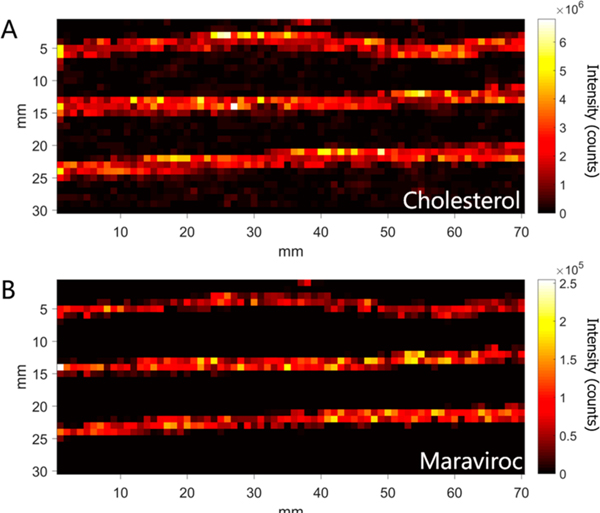
Figure 1.

Mass spectrometry images of 3 hair strands from an HIV+ patient adherent to maraviroc. Ion images correspond to (A) cholesterol (m/z 369.3516, (M + H − H2O)+), as an endogenous marker, and (B) maraviroc (m/z 514.3352, (M + H)+), the drug of interest.
