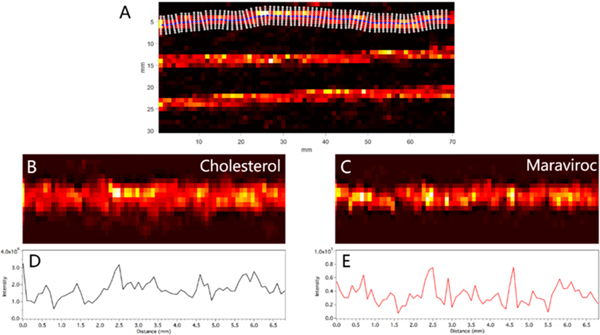
Figure 2.

(A) Ion image from Figure 1 of cholesterol showing line fit to the center of the top strand and the vectors normal to that line. (B) Ion image of cholesterol after straightening algorithm is applied. (C) Ion image of maraviroc from the same strand after straightening algorithm is applied. (D) Longitudinal profile of cholesterol ion abundance along the length of the straightened image in panel B). (E) Longitudinal profile of maraviroc ion abundance on the length of the straightened imaged in panel C.
