
Figure 4.
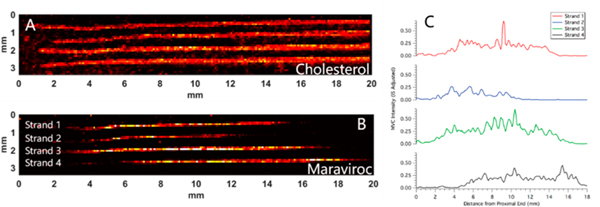
Ion images and profiles from the same volunteer in the DOT study as shown in Figure 3 (V-6). Sample collected 28 days after 28 days of daily dosing with maraviroc. (A) Ion image corresponding to cholesterol. (B) Ion image from the same hair strands corresponding to maraviroc (corrected by IS). (C) Longitudinal profiles showing the intensity of maraviroc along the length of the hair strands in panel B. Each of the profiles were smoothed by moving average (n = 3). The top profile corresponds to the top strand in the image.