
Figure 5.
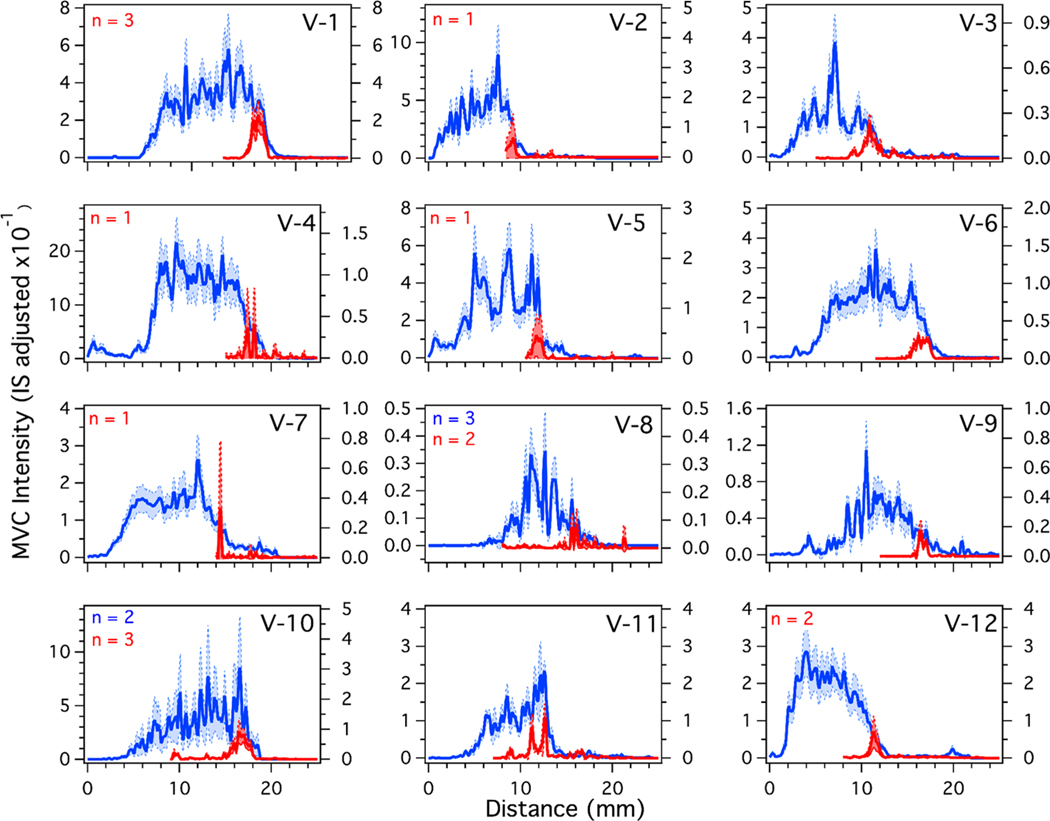
Average longitudinal profiles for single doses (red) and daily doses (blue) of MVC given to all 12 volunteers. The traces were generated, aligned, and averaged using MATLAB. After averaging, the profiles were smoothed by moving average (n = 3). The shaded areas indicate the 95% confidence interval. The traces are an average of 4 strands for both daily and single doses unless indicated in the figure.