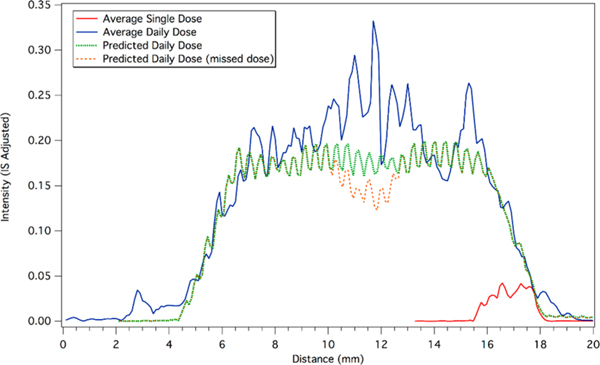
Figure 6.

Average longitudinal profiles for single doses and a daily doses of maraviroc. The lowest intensity signal (red) corresponds to an average single dose from the 4 profiles in Figure 3. The average single dose has been offset on the x-axis to coincide with the start of the predicted profile. The highest intensity signal (blue) corresponds to the average of the 4 profiles from Figure 4. The dashed trace (green) is the predicted profile for 28 days of daily dosing based on a linear superposition of multiple average single doses. The second dashed trace (orange) corresponds to the predicted profile for 28 days of daily dosing, with a hypothetical missed dose on day 14.
