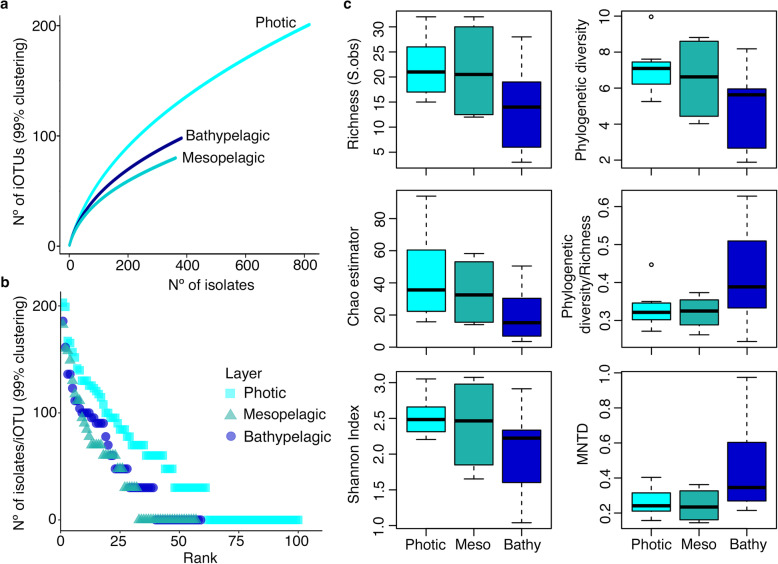
Fig. 2.
Diversity measures per layer studied. a Rarefaction curves extracted from the non-rarefied iOTU Table (99% clustering). b Rank abundance plots showing the number of isolates per iOTU (at 99% clustering) obtained in the three layers studied also for the non-rarefied iOTU Table. Y axis are in log10 scale. Photic: surface and deep chlorophyll maximum (DCM); Meso: mesopelagic; and Bathy: bathypelagic ocean. c Alpha-diversity measures using OTU-based (left panels) and phylogenetic (right panels) approaches. MNTD: mean nearest taxon distance.

