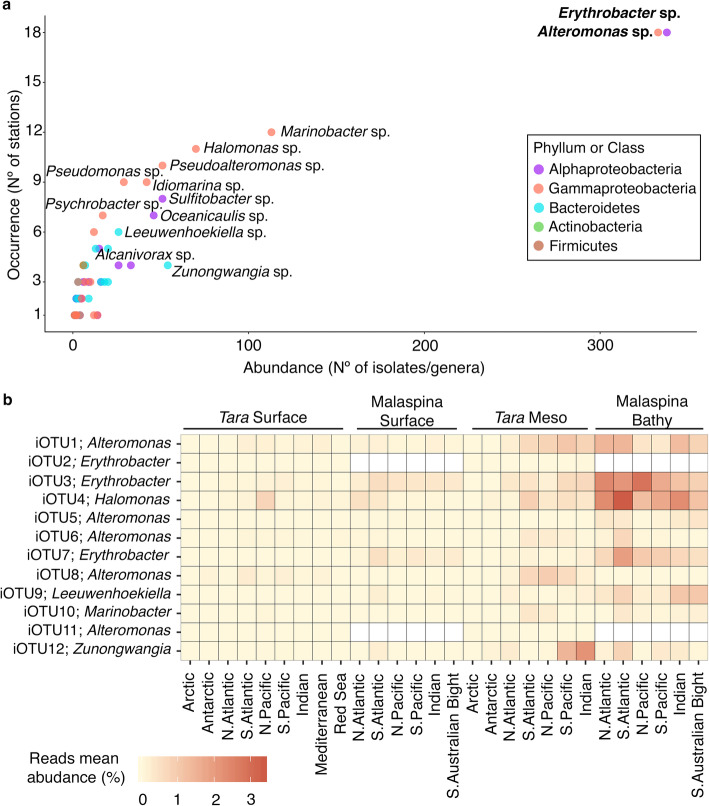
Fig. 4.
Abundance and biogeography of the isolates retrieved. a Abundance vs occurrence of the genera retrieved in the total culture collection. The most abundant and common genera are indicated in bold, and in regular type those with a more regional distribution. The color of the dots indicates the taxonomic (phylum or class) affiliation of the iOTUs. b Heatmap representing the mean abundance of reads (%) from zOTUs (zero-radius OTUs) of the top12 isolated OTUs (rows) along the different oceanographic regions studied in the Tara and Malaspina expeditions samples (columns). Subsampled zOTU-abundance tables from the different datasets have been used

