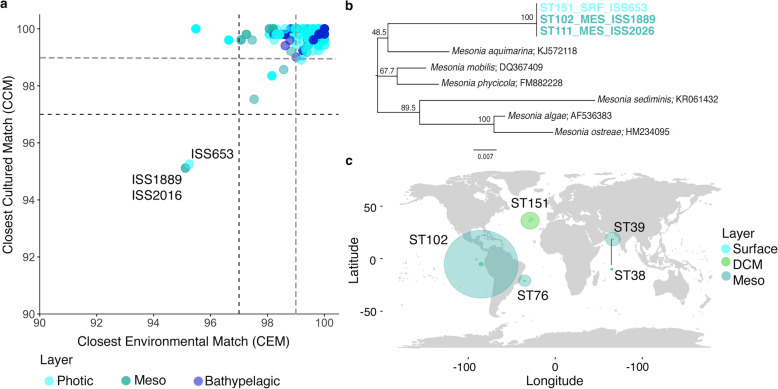
Fig. 5.
Potential novel isolates. a Percentages of similarity between the Closest Cultured Match (CCM) and the Closest Environmental Match of all the 16S rRNA gene sequences. Horizontal and vertical lines represent the typical cut-off value of 97% (black dashed lines) and 99% (grey dashed lines) commonly used for “species” delineation. b Neighbour Joining tree of the putative Mesonia isolates. The numbers in the nodes represent bootstrap percentages > 45%, calculated from 1000 replicates. Putative new isolates are written in bold letters and color indicates origin of the isolates. c Read recruitment of ISS653 and ISS1889 in 5 Tara Oceans stations. They include the stations where the isolates were retrieved (ST151 and ST102) and some distant stations for the sake of comparison (ST39, ST38, ST76). ST38 is located near ST39 (Latitude 19° 2.24′ N, Longitude 64° 29.24′ E), but its location in the plot was slightly modified for its correct visualization. Size of the circles are the sum of the abundance of reads from both genomes recruited in each station and layer (x10k). SRF, surface isolates; DCM, deep chlorophyll maximum; Meso, mesopelagic isolates

