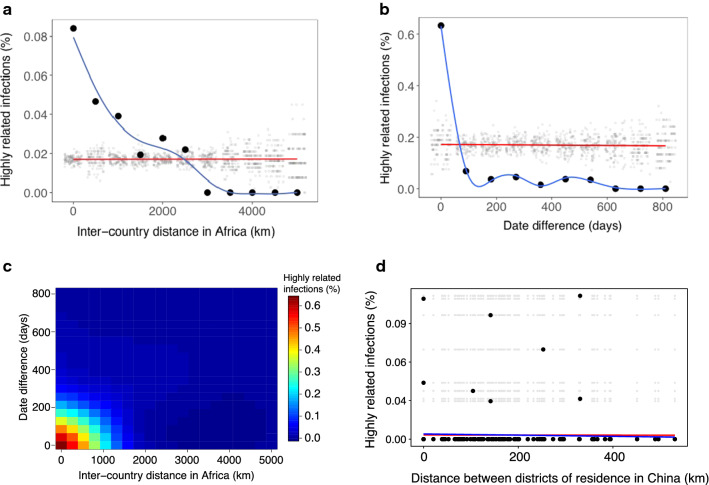
Fig. 3.
Characterization of highly related infections. a Relationship between the proportion of highly related infections and distance between destination countries in Africa. b Relationship between the proportion of highly related infections and date difference in the reporting of malaria cases in Jiangsu, China. c Relationship between the proportion of highly related infections, distance and reporting time. Genetically related infections were usually imported from shared trips to a similar destination. d Relationship between the proportion of highly related infections and distance between residence district in Jiangsu, China. For panels A, B and D, black dots and blue lines indicate the observed and fitted data, respectively. The grey dots and red lines indicate a null distribution from a permutation test

