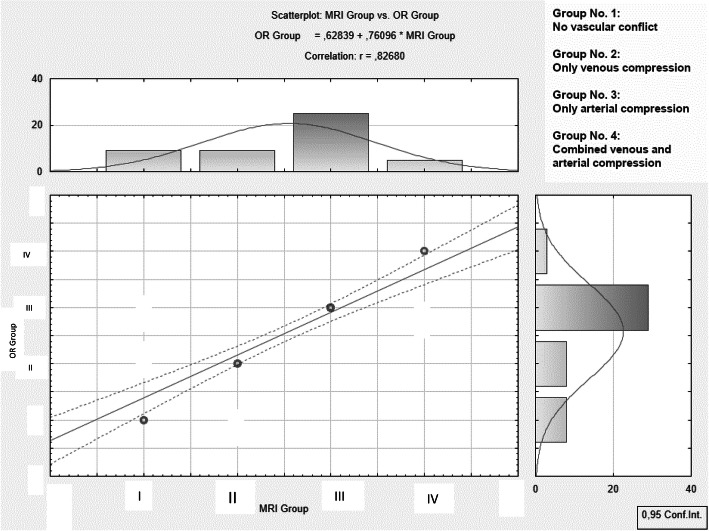
Fig. 3.
Correlation between the MRI findings and microsurgical observations during MVD. The graph shows the classification of the vascular conflict created by MRI on the x-axis as well as by microsurgical groups on the y-axis in the following order: 1 - no vascular conflict; 2- purely venous compression; 3 - purely arterial compression; 4 - combined venous and arterial compression. The MRI findings correctly predicted the intraoperative findings in 91.7% in the 48 patients. The percentage of correct prediction increased from 80 to 94.7%, if TOF angiography was combined to the T2 sequences. Pearson’s correlation between the MRI data and surgical findings was significant: r = 0.827, p < 0.05. With the combination of T2 sequences and TOF angiography the prediction rate of postoperative pain relief was significantly enhanced

