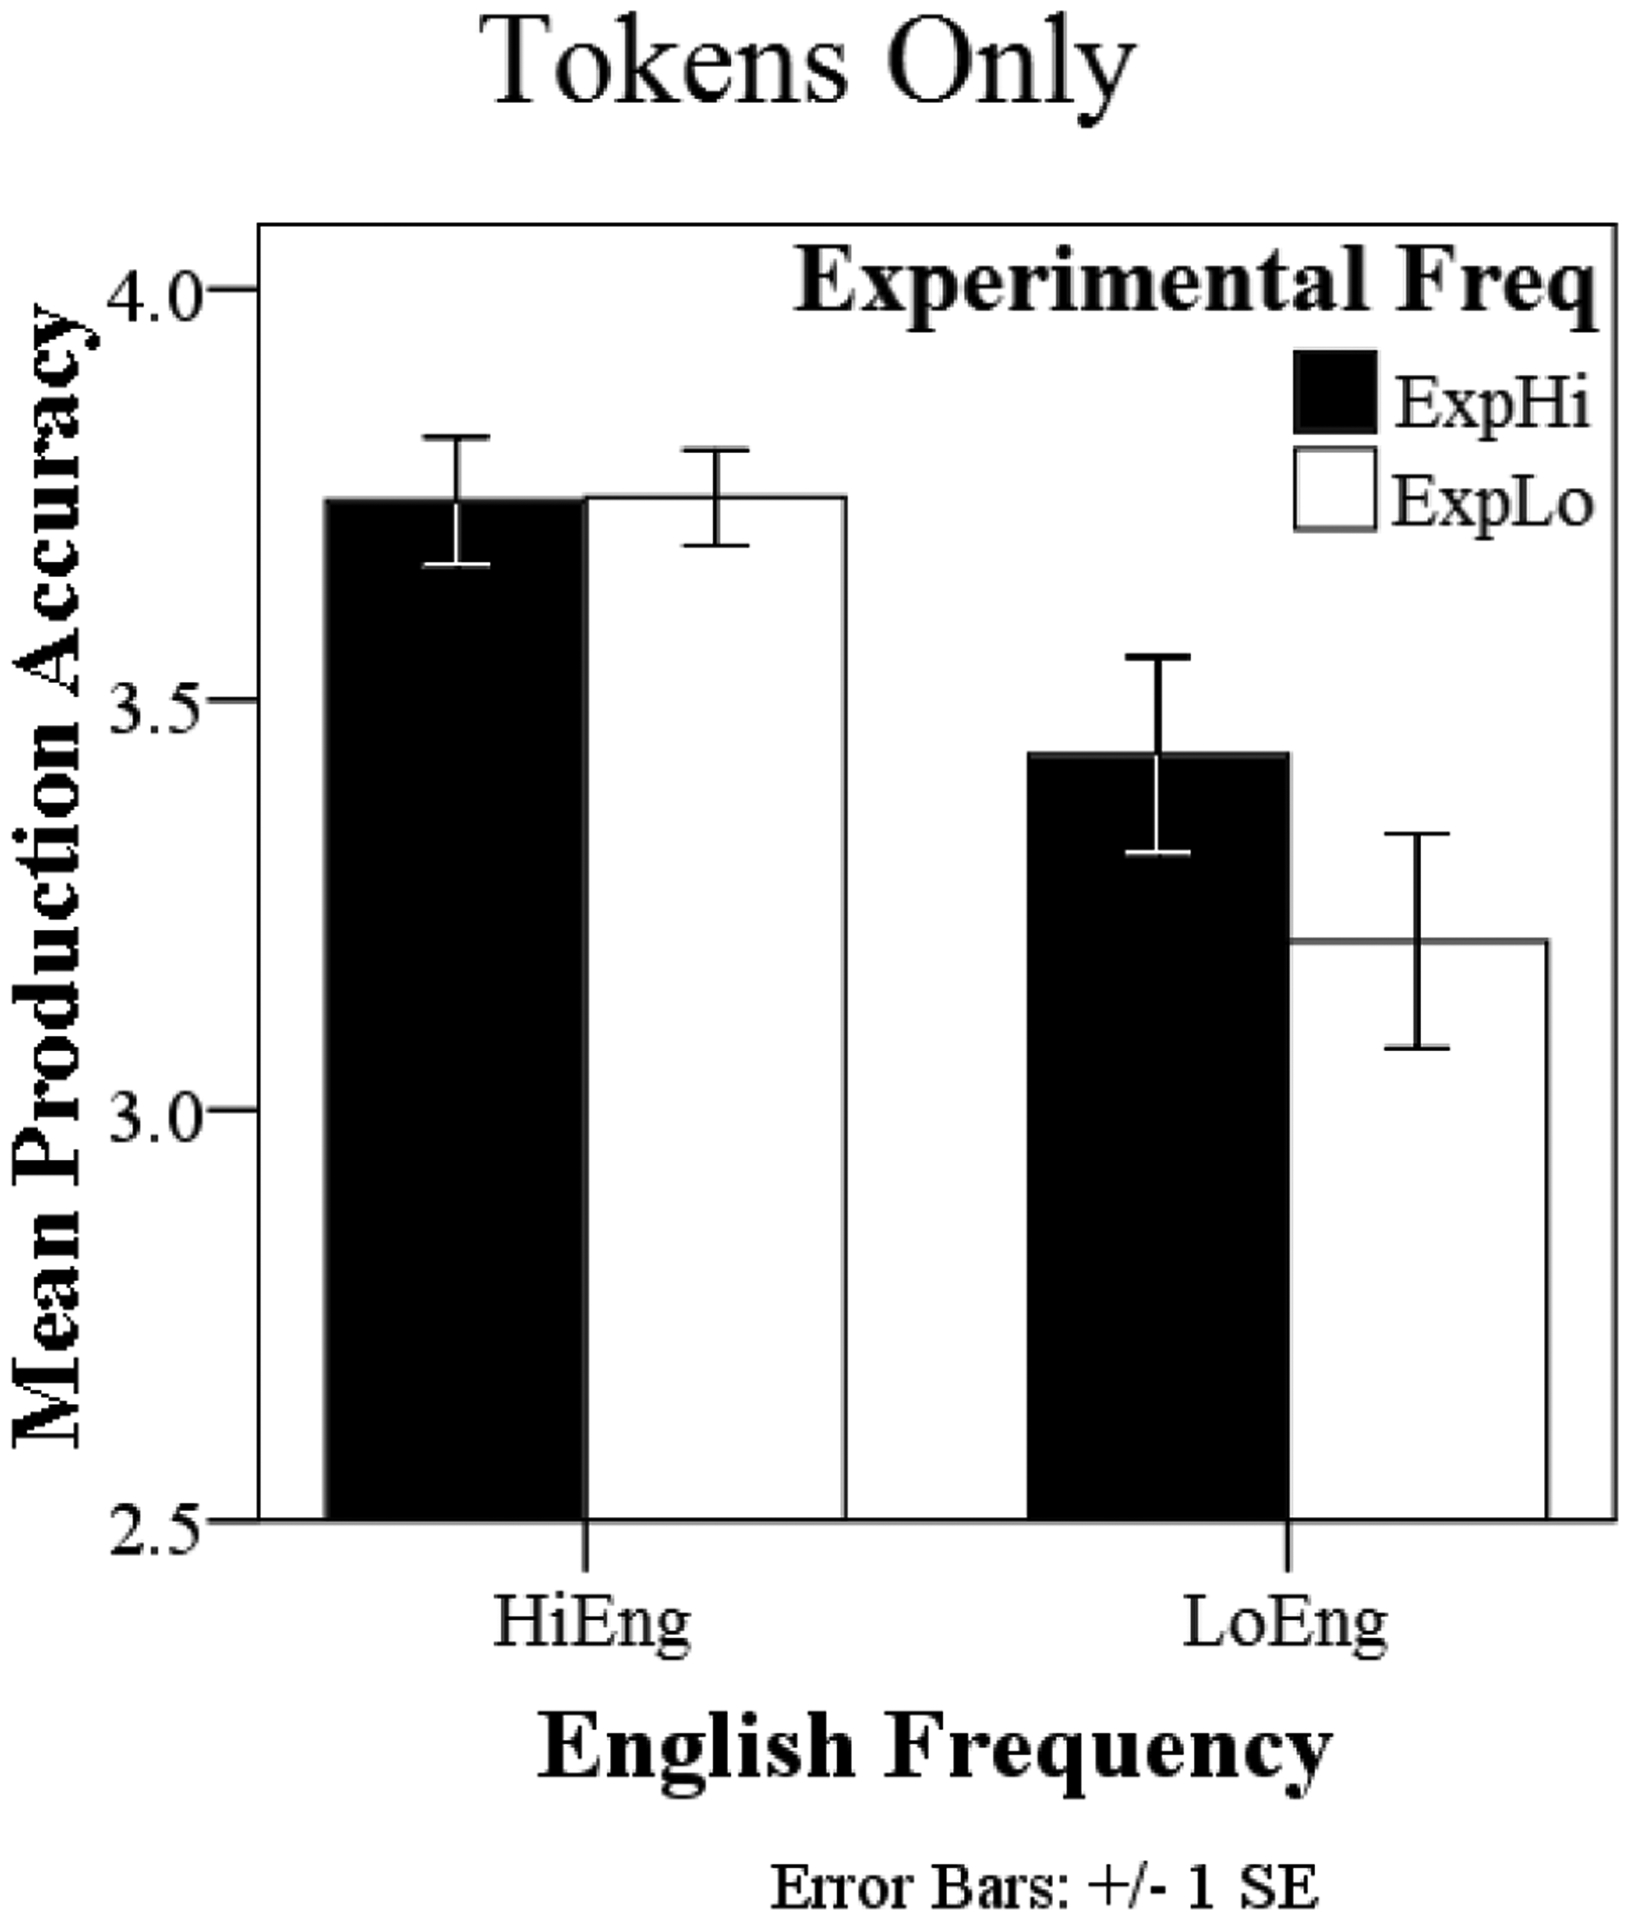
Figure 2.

Bar graphs of the accuracy results from Experiment 1 - tokens only familiarization. On the ordinate is the mean production accuracy for the medial consonant sequences, with a score of ‘4’ being accurate production of both consonants. The bars are shaded according to experimental frequency. Black bars represent the average accuracy for the ExpHi sequences, white bars represent the ExpLo sequences. Bars are grouped by English Frequency. Results for the HiEng sequences are on the left, results for the LoEng sequences are on the right.
