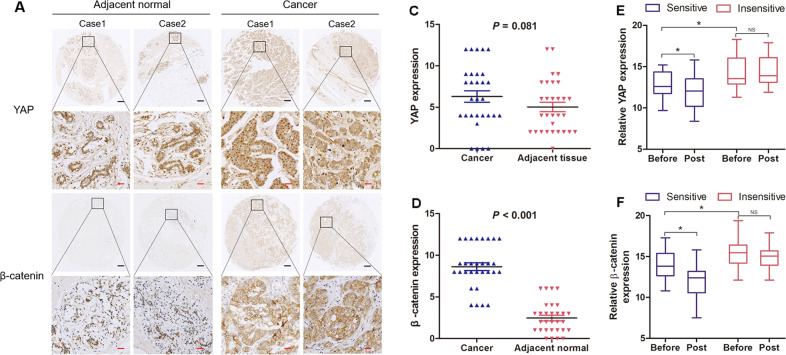
Fig. 1. Different expression levels of YAP and β-catenin in human breast cancer.
a, b Immunostained tissue microarray slides for YAP and β-catenin in breast cancer and normal tissues were analysed. Black scale bar: 200 µM and red scale bar: 25 µM. c, d Relative expression levels of YAP and β-catenin in human breast cancer and adjacent normal tissue are shown. The immunoreactivity score distributions of cancer and adjacent normal tissue are represented with blue and red closed arrows, respectively. The horizontal lines represent the means; error bars represent the SD from 30 samples. e, f Dynamic expression changes in YAP or β-catenin before and after NCT in TNBC. RT-PCR was employed to detect the RNA expression levels of YAP and β-catenin before and after NCT. The RNA expression levels of chemotherapy-sensitive and chemotherapy-insensitive breast cancer tissues are represented with blue and red boxes, respectively. Relative YAP expression: in the sensitive group Before vs Post (P = 0.009); Before in sensitive group vs Before in insensitive group (P = 0.017). Relative β-catenin expression: in the sensitive group Before vs Post (P = 0.003); Before in sensitive group vs Before in insensitive group (P = 0.007). Before, before chemotherapy. Post, after chemotherapy. Statistical significance was determined using Student’s t test analysis.

