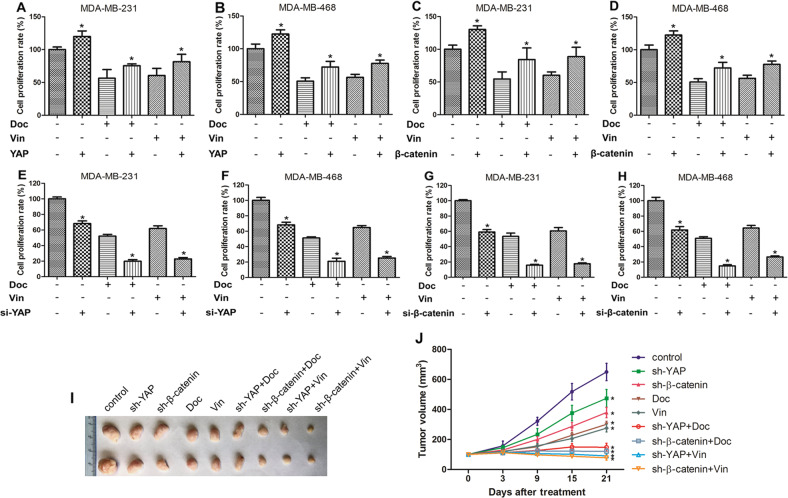
Fig. 2. YAP and β-catenin affect the growth-inhibiting effects of docetaxel and vinorelbine on TNBC cells.
a CCK-8 assay for MDA-MB-231 and MDA-MB-468 cells cultured with control, pCMV-Flag-YAP-5SA (activated YAP), 5 nM docetaxel (Doc), 5 μM vinorelbine (Vin), pCMV-Flag-YAP-5SA and Doc or Vin for 48 hours. Control group vs YAP group (P = 0.005); Doc group vs Doc + YAP group (P = 0.030); Vin group vs Vin + YAP group (P = 0.036). The rest of the CCK-8 assays were similar to those described above. b Control group vs YAP group (P = 0.004); Doc group vs Doc + YAP group (P = 0.005); Vin group vs Vin + YAP group (P < 0.001). c pcDNA3.0-β-catenin was used for β-catenin overexpression. Control group vs β-catenin group (P < 0.001); Doc group vs Doc + β-catenin group (P = 0.029); Vin group vs Vin + β-catenin group (P = 0.010). d Control group vs β-catenin group (P = 0.004); Doc group vs Doc + β-catenin group (P = 0.005); Vin group vs Vin + β-catenin group (P < 0.001). e, f siRNA-YAP was used for YAP knockdown. Control group vs si-YAP group (P < 0.001); Doc group vs Doc + si-YAP group (P < 0.001); Vin group vs Vin + si-YAP group (P < 0.001). g, h Control group vs si-β-catenin group (P < 0.001); Doc group vs Doc + si-β-catenin group (P < 0.001); Vin group vs Vin + si-β-catenin group (P < 0.001). The data are presented as the mean ± SD of experiments performed in triplicate. Tumour formation assays in nude mice subcutaneously injected with MDA-MB-231 cells. The specific treatment was performed as described in the “Materials and Methods”. i Photograph of the tumour tissue. j Tumour growth was assessed every 3 or 6 days until treatment day 21 by measuring two perpendicular diameters and calculating the volume. Doc, docetaxel; Vin, vinorelbine; sh-YAP, lentiviral vector of YAP shRNA; sh-β-catenin, lentiviral vector of β-catenin shRNA. The data presented are means ± SDs; error bars represent the SD from five mice. Control group vs different treatment groups (P < 0.001). Statistical significance was determined using Student’s t test and one-way ANOVA test analysis.

