Figure 2.
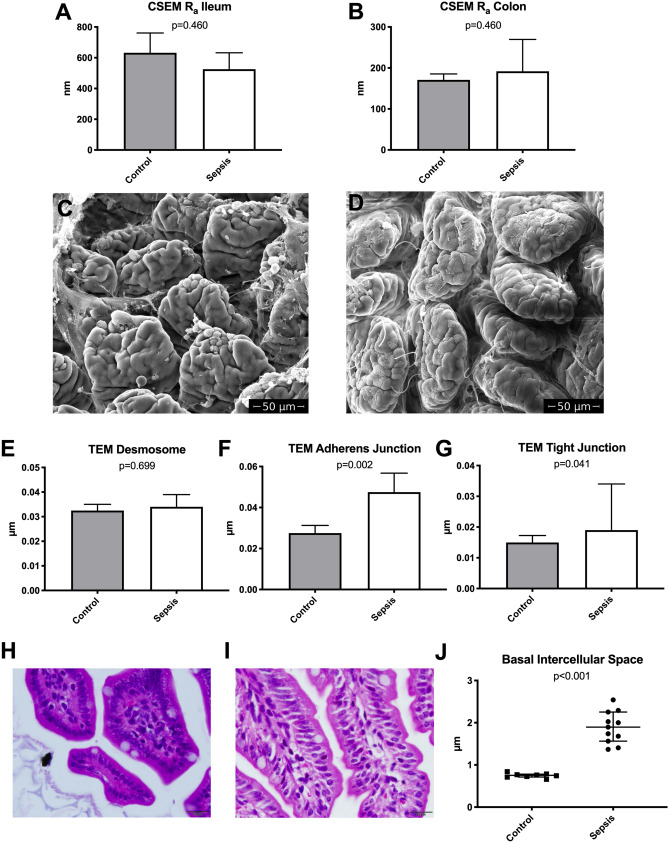
Light and electron microscopy (CSEM and TEM) results. (A, B) 3D reconstruction-derived surface roughness (Ra) in ileum (A) and colon (B) (bar represents median, whiskers IQR). CSEM images of small intestine of a septic (C) and a control (D) mouse. Intercellular distances at Desmosome (E), AJ (F) and TJ level (G) (bar represents median, whiskers IQR). Bottom row: light microscopy of a control (H) and a septic (I) mouse (H&E staining, magnification × 400, scale bars represent 20 µm). Septic animals showed significantly increased intercellular distances at the basal levels of the IECs (J).

