Figure 2.
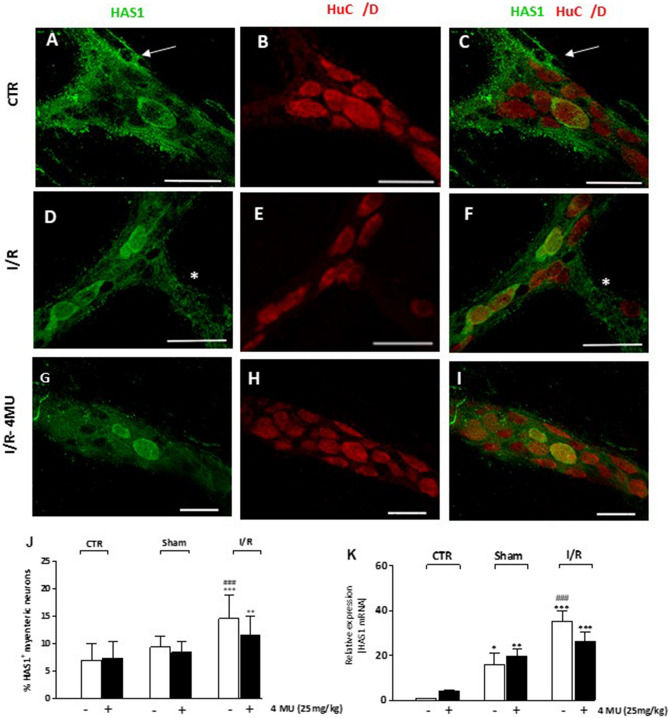
I/R-induced changes of HAS1 expression in the rat small intestine myenteric plexus (A–I) Confocal images showing co-localization of HAS1 with the pan neuronal marker HuC/D in myenteric neurons of CTR animals (A–C), after I/R injury (D–F) and in the 4-MU-treated I/R group (G–I). HAS1 stained the soma and cytoplasmic membranes of ovoid myenteric neurons, interconnecting fibers (*) and enteric glial cells (arrow). Panel J shows the percentage of myenteric neurons co-staining for HuC/D and HAS1. Bar 50 μm. **P < 0.01, ***P < 0.001 vs. CTR, ###P < 0.001 vs. sham-operated by one-way ANOVA with Tukey’s post hoc test. N = 5 rat/group (K) HAS1 mRNA levels in LMMP preparations obtained from the different experimental groups. Histograms show HAS1 relative gene expression determined by comparing 2−ΔΔCt values normalized to β-actin. *P < 0.05, **P < 0.01, ***P < 0.001 vs. CTR, ###P < 0.001 vs. sham-operated by one-way ANOVA with Tukey’s post hoc test. N = 5 rat/group.

