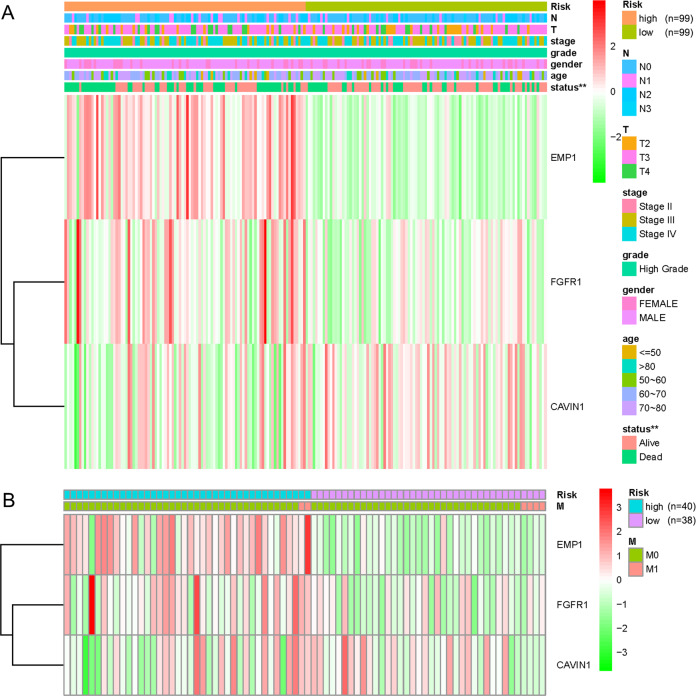
Fig. 6. Comparison of clinicopathological characteristics and expression of EMP1, FGFR1, and CAVIN1 between the high-risk and low-risk subgroups.
a The clinicopathological features, which included N, T, stage, grade, gender, age, and survival status, and the expressions of EMP1, FGFR1, and CAVIN1 distributed in the heatmap of 2 risk subgroups of 198 patients. **p < 0.01. b The clinicopathological features of M and the expressions of EMP1, FGFR1, and CAVIN1 distributed in the heatmap of 2 risk subgroups of 78 patients.

