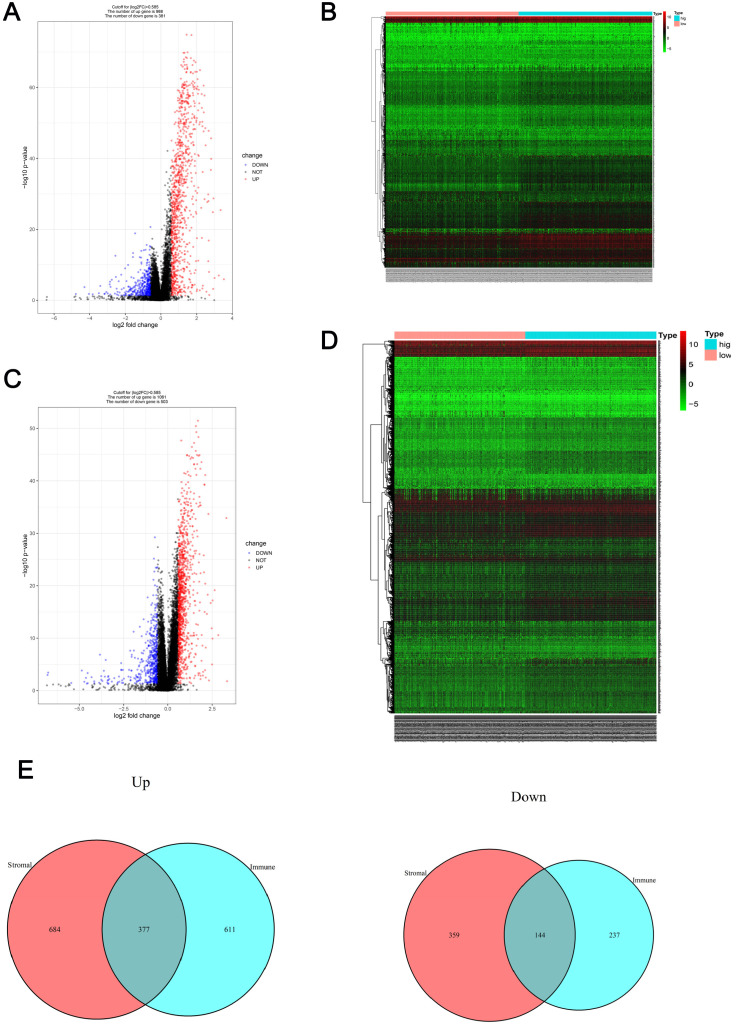
Figure 2.
Gene expression profile comparison of patients with RCC with different immune cell and stromal cell scores (A-B) The volcano plot and heatmap show the 1369 genes (988 up-regulated and 381 down-regulated) identified based on the immune cell scores. (C-D) The volcano plot and heatmap show the 1564 genes (1061 up-regulated and 503 down-regulated) identified based on the stromal cell scores. (E) Venn diagrams show the 377 co-upregulated and 144 co-downregulated genes.

