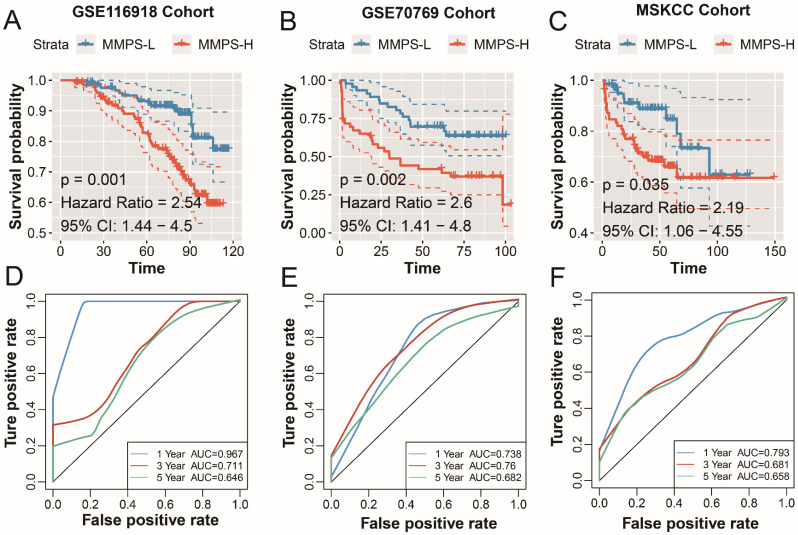
Figure 5.
Validation of the MMP-related prognostic model in external cohorts. K-M plot showed the RFS results of the MMPS-H (orange) and MMPS-L (blue) groups in GSE116918 cohort (A), GSE70769 cohort (B) and MSKCC cohort (C); The 1-year, 3-year and 5-year ROC curves in GSE116918 cohort (D), GSE70769 cohort (E) and MSKCC cohort (F).

