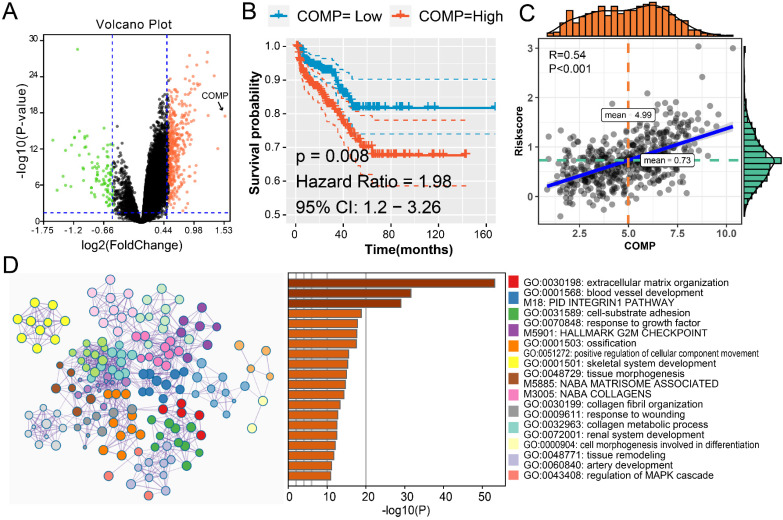
Figure 6.
The MMPs driven mechanisms in MMPS-H group. (A) Volcano plot showed the DEGs among MMPS-H and MMPS-L groups; (B) K-M plot showed the RFS results of high and low mRNA level of COMP. (C) The correlation between COMP expression and MMPS risk score. (D) The pathway enrichment results of the 392 up-regulated genes in MMPS-H group.

