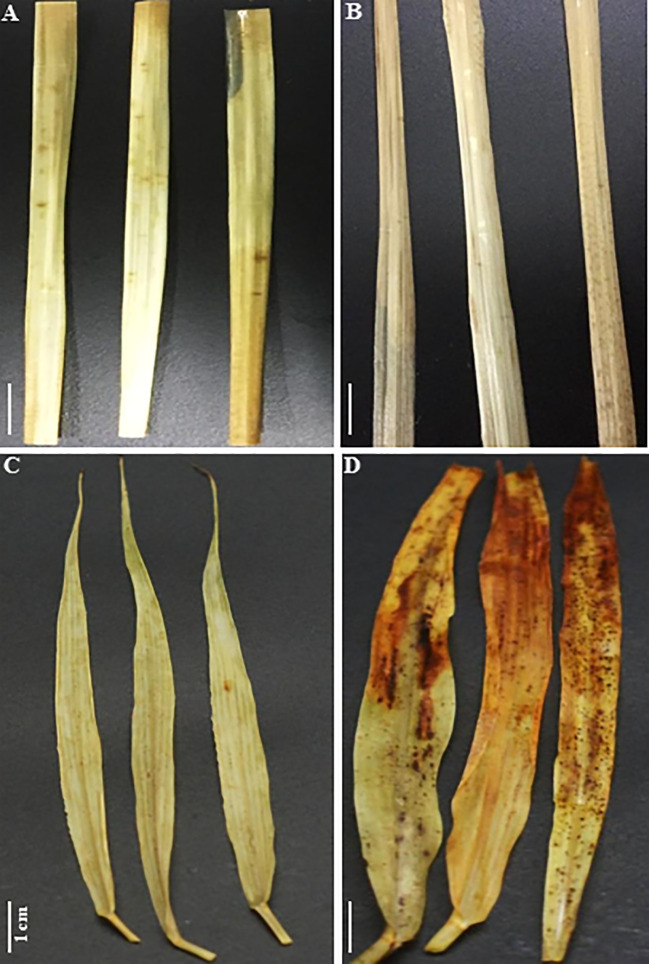
Figure 10.
Histochemical staining of SV (C, D) and SA (A, B) leaves obtained from control untreated (A, C) or salt treated (B, D) for SV at 50 mM and SA at 250 mM during 12 days with 5 mM DAB (diaminobenzidine). Brown spots reflect the interaction of hydrogen peroxide (H2O2) with DAB under light (500 μmol m−2 s−1) in leaves following salt stress treatment. The white bar represents the scaling bar of 1 cm length.

