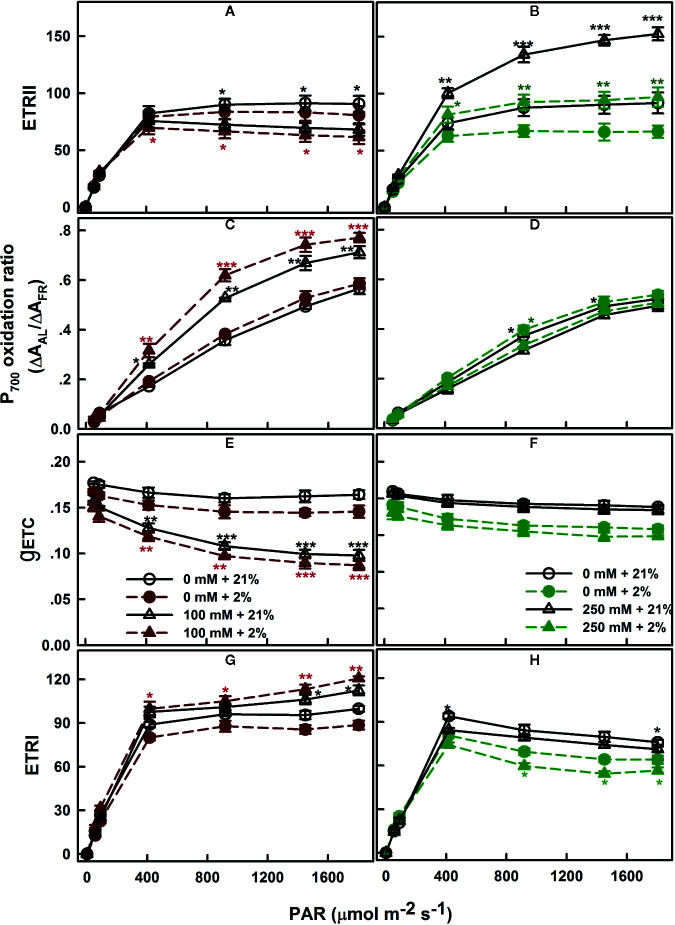
Figure 5.
Oxygen dependence of electron transport: ETRII (A, B), P700 oxidation ratio (C, D), g ETC (E, F), and ETRI (G, H), measured in leaves of SV (left column, A, C, E, G) and SA (right column, B, D, F, H) endured NaCl (triangles): 100 mM for SV and 250 mM for SA. Control plants (circles) were maintained in a NaCl-free medium. The measurements were performed, 12 days after initiating salt treatment, under saturating CO2 (2,000 μl L−1), at 25°C and in the presence of 21% (open symbols) or 2% (closed symbols) oxygen. Each data point represents the means of at least six replicates ± SE. The stars above the curves display the significance levels between control and salt treatment at P ≤0.05 (*), P ≤0.01 (**) or P ≤0.001 (***).

