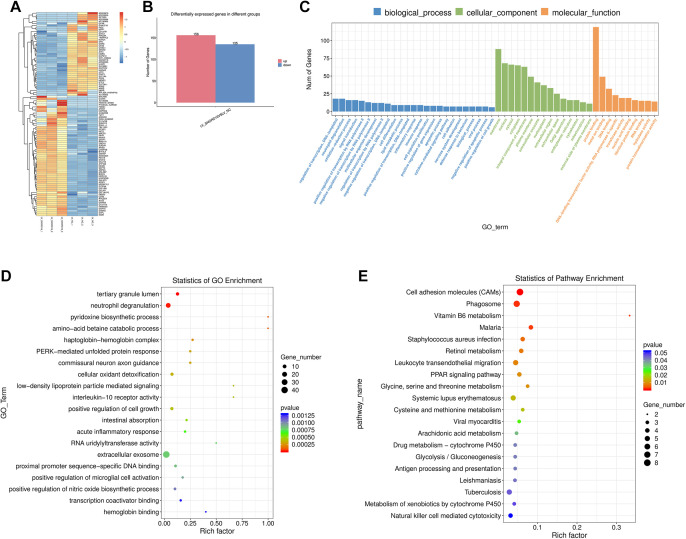
Figure 5.
RNA sequencing and bioinformatics analysis. A, Heat map of the SNORD16-regulated genes in HCT116 cells. (B) Barplot of differentially expressed genes. (C-D) Gene ontology (GO) enrichment analysis of SNORD16-regulated genes. E, Kyoto Encyclopedia of Genes and Genomes (KEGG) pathway analysis of SNORD16-regulated genes.

