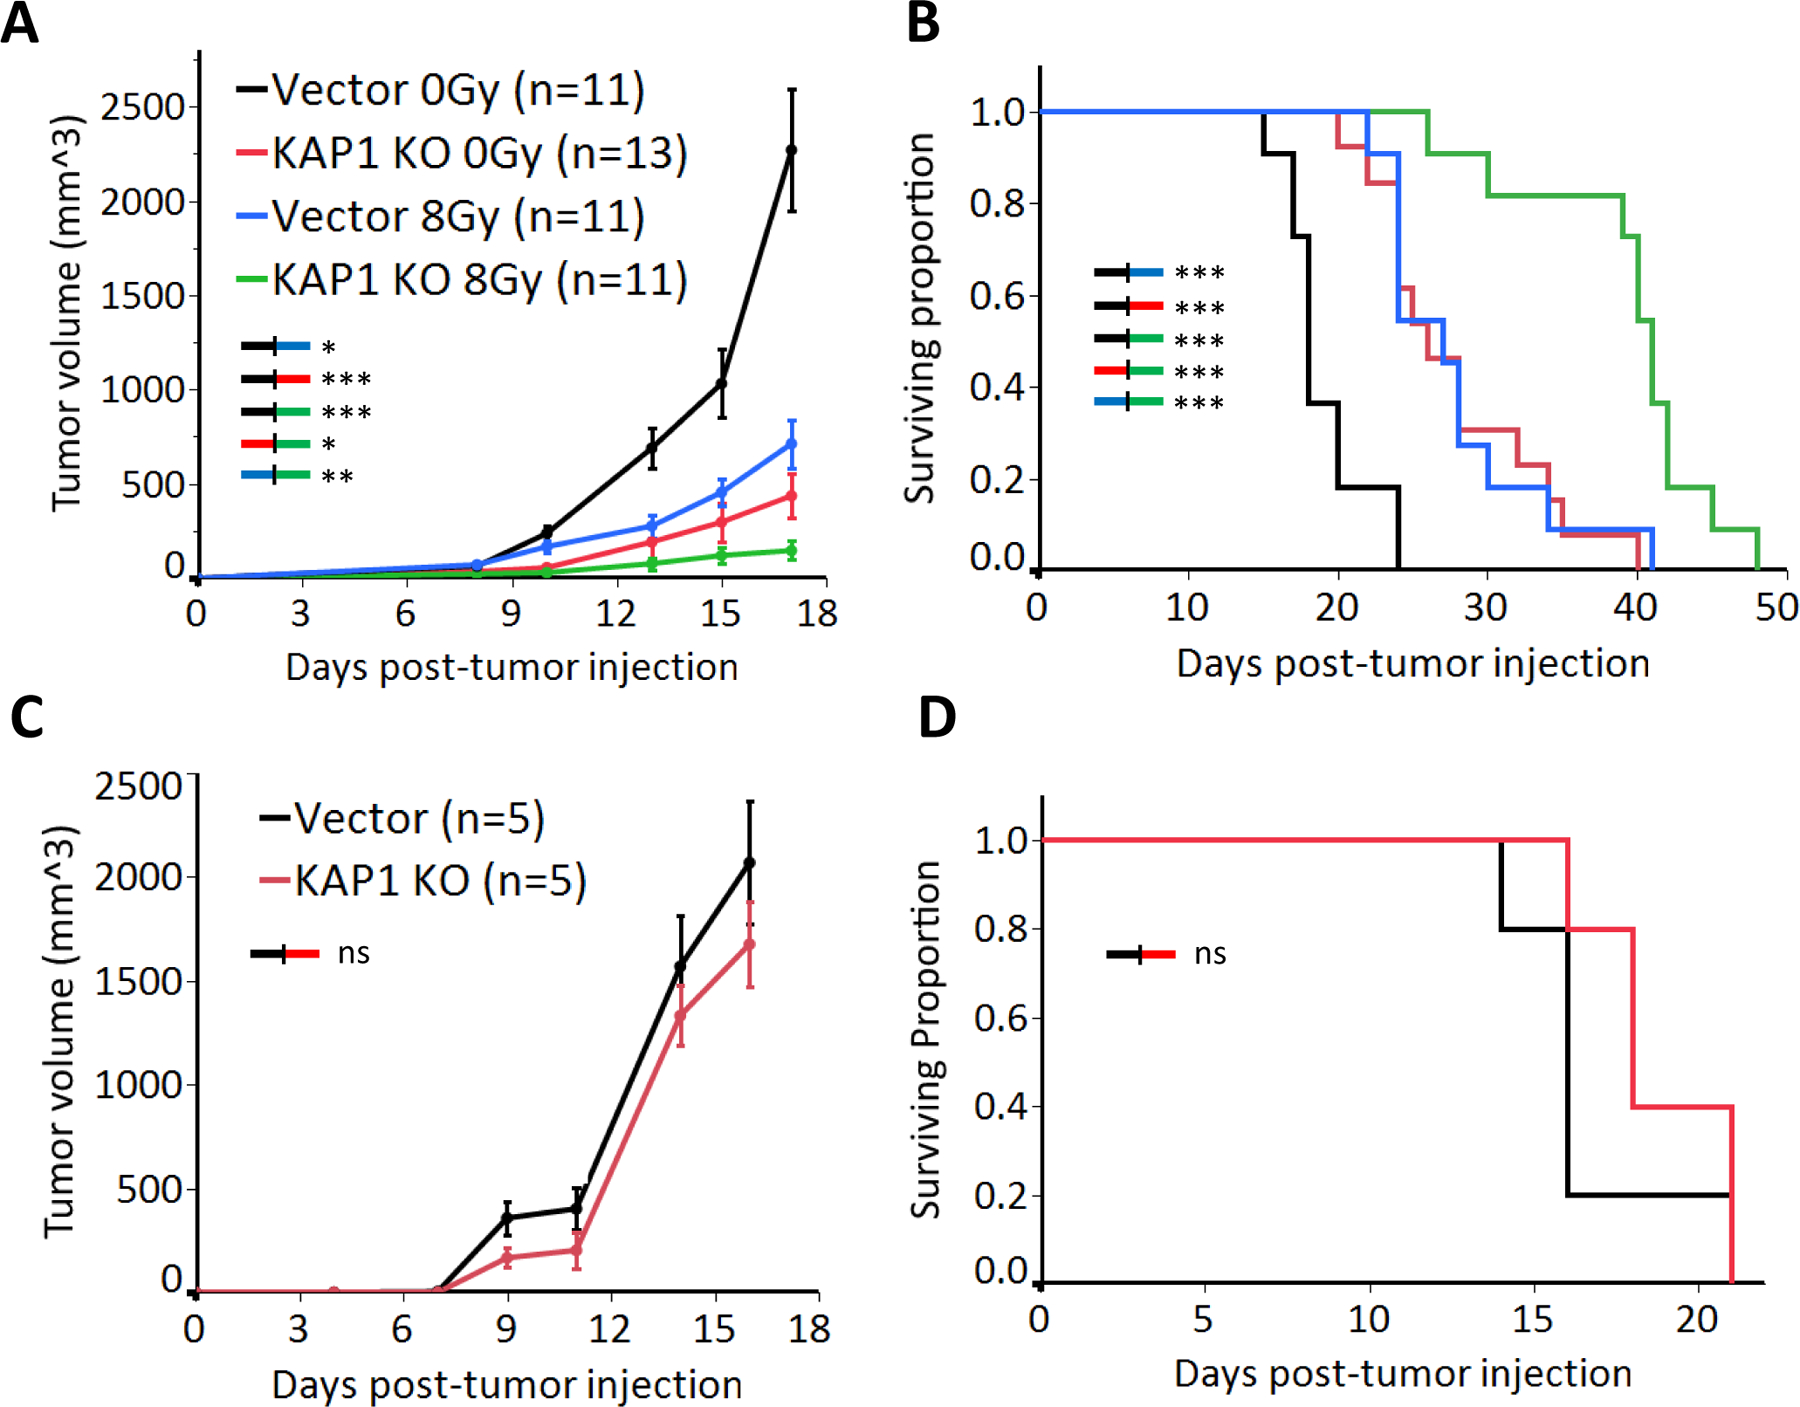
Figure 4. KAP1 knockout inhibits B16F10 melanoma growth in syngeneic C57BL/6 and immunodeficient NSG mice.

(A, B). Tumor growth (A) and Kaplan-Meier survival curve in immunocompetent C57BL/6 host mice(B) inoculated with 105 vector control or KAP1 knockout B16F10 cells and treated with 0Gy or 8Gy X-rays at day 8 post inoculation.
(C, D). Tumor growth (C) and survival curves (D) in immunodeficient NSG mice inoculated with 105 vector control or KAP1 knockout B16F10 cells.
Data in A&B represent three separate experiments. Error bars represent SEM. *p<0.05, **p<0.01, ***p<0.001, ns, not significant, as determined by one-way ANOVA (A and C) or Log-Rank test (B and D)
