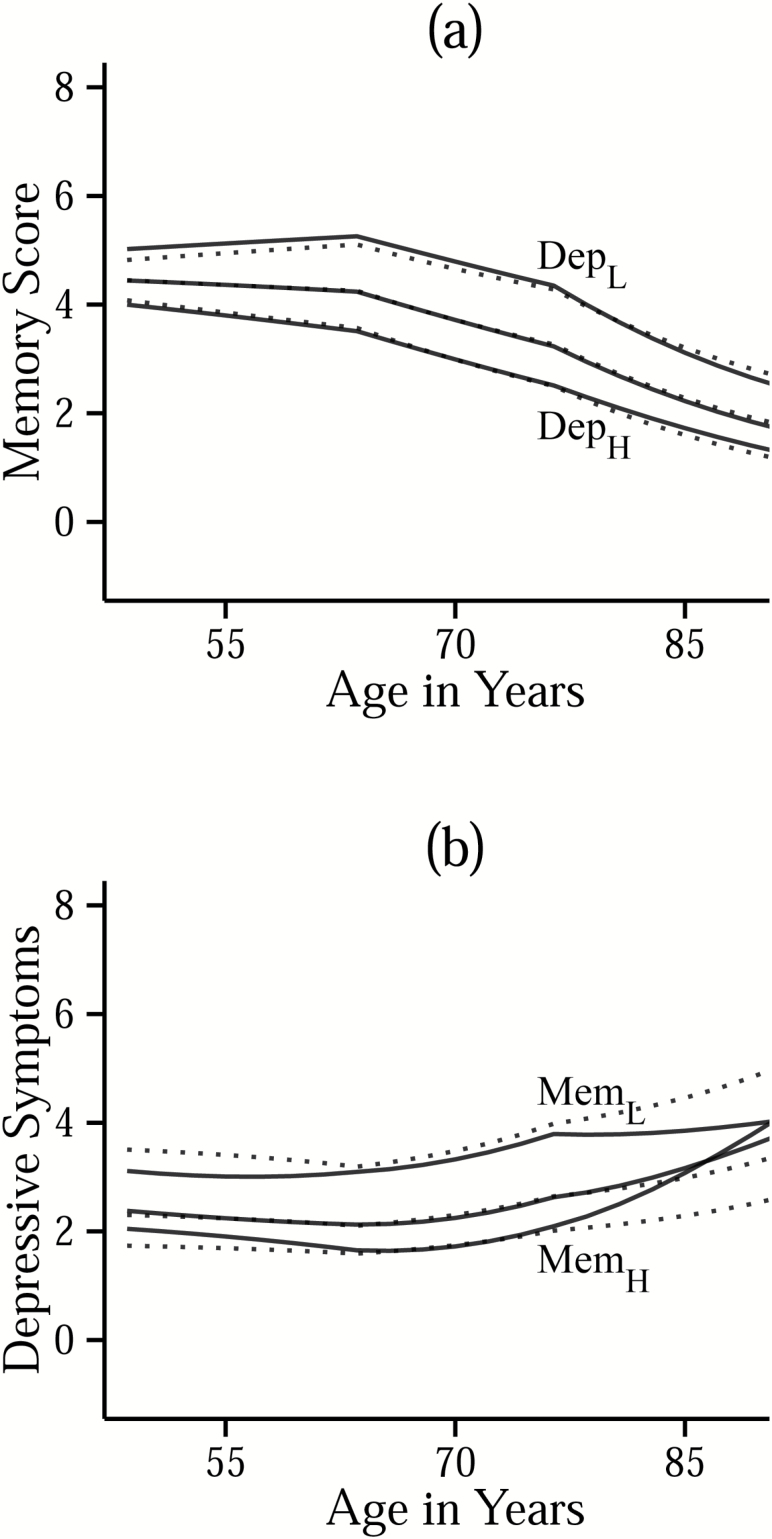
Figure 2.
Panel (a) shows trajectories of estimated memory scores within sub-samples of participants with different baseline levels of depressive symptoms: low (≤ -1.5SD; DepL), mid (> -1.5SD and < 1.5SD; unlabeled), and high (≥ 1.5SD; DepH). Panel (b) shows trajectories of estimated depressive symptoms within sub-samples of participants with different baseline levels of memory scores: low (≤ -1.5SD; MemL), mid (> -1.5SD and < 1.5SD; unlabeled), and high (≥ 1.5SD; MemH). Solid lines indicate trajectories estimated from the full coupling model (M1d), and dotted lines are trajectories estimated from the nocoupling model (M1a).

