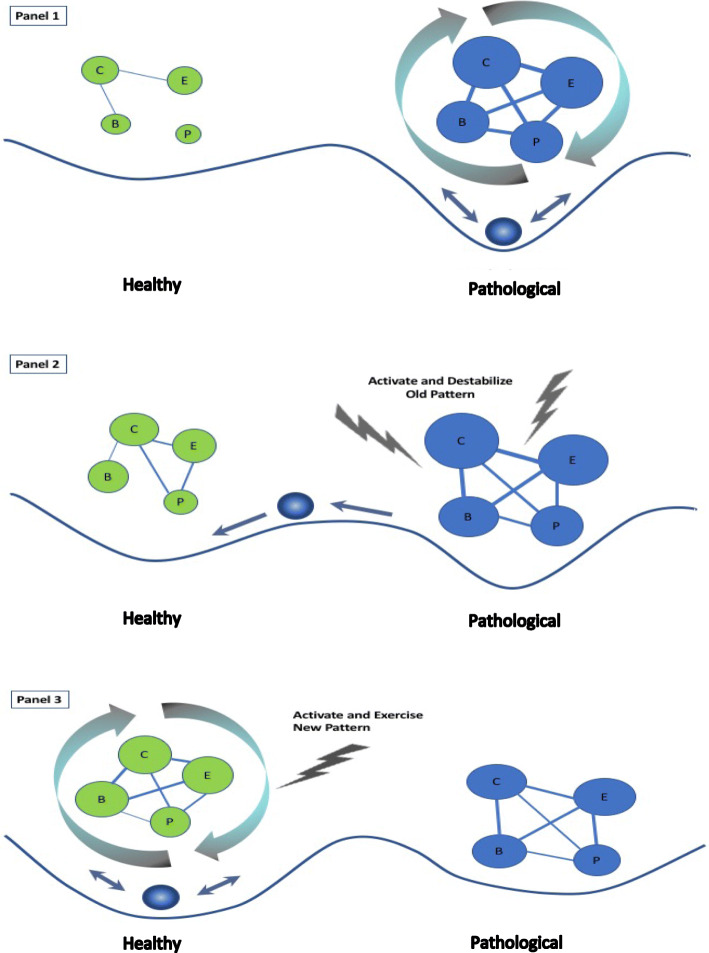
Fig. 1.
Network destabilization and transition (NDT) model. Attractor landscapes are depicted with the solid line and ball, which represents the state of the system. Pathological and more healthy networks are depicted with nodes of cognition (C), emotion (E), behavior (B), and physiological responses (P) and associated feedback loops. Larger nodes (circles) are stronger, and thicker lines represent stronger connections. Panel 1 depicts a well-established pathological attractor with a hypothetical network that is strongly interconnected and maintained by amplifying feedback loops. Panel 2 depicts a pathological attractor that is less strong. The adaptive attractor in panel 2 is more developed than in panel 1 and provides an alternative for the ball to enter when the pathological network is activated and destabilized. With repeated activation, exercise, and amplifying feedback loops (panel 3), the healthy attractor becomes stronger than the pathological attractor

