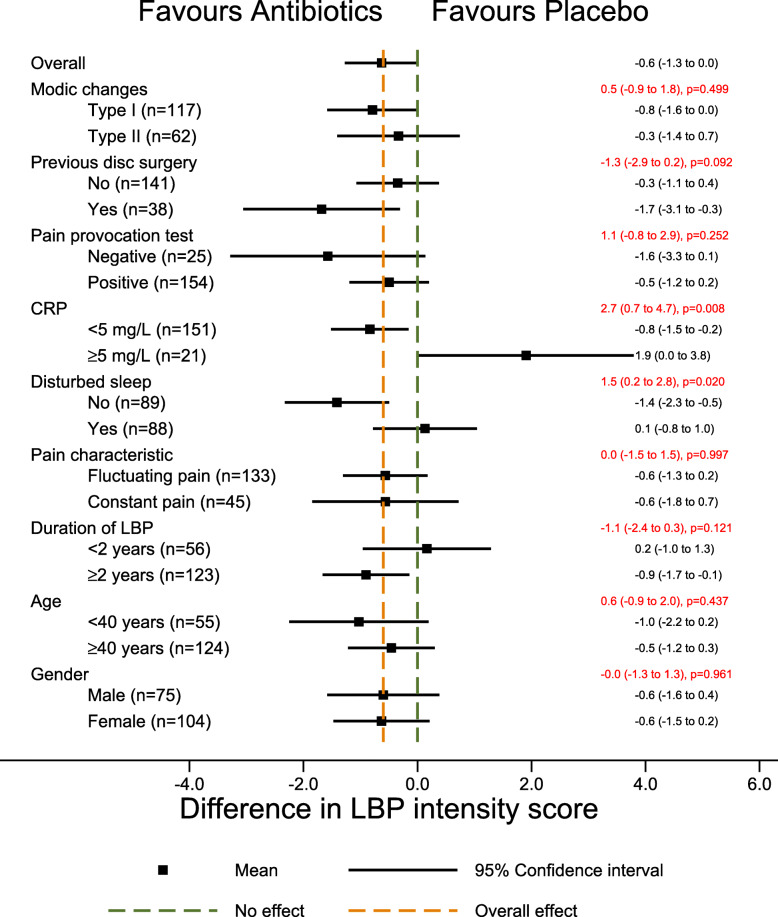
Fig. 3.
Forest plot with results for low back pain intensity (secondary outcome). The difference in mean low back pain intensity score between the treatment groups (size of treatment effect) with 95% confidence interval is shown in black on the right for each of the two categories of each potential effect modifier. The difference in size of treatment effect between the two categories (estimated by the interaction term), with 95% confidence interval and p-values is shown in red. CRP C-reactive protein. ODI Oswestry Disability Index. Score from 0 to 100. Higher scores indicate more severe pain and disability. LBP Low back pain

