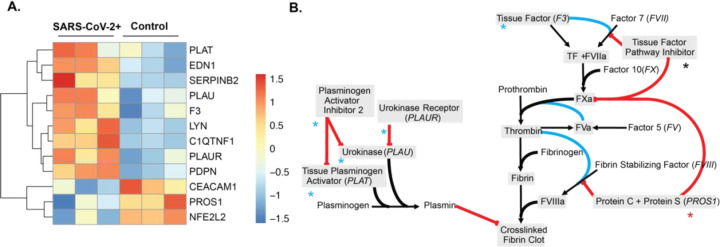
Figure 1: The gene expression profile of differentially expressed genes within the enriched the regulation of blood coagulation GO term for SARS-CoV-2 infected NHBE cells.
(A) Heatmap of all differentially expressed genes (Padj > .2) enriched in the regulation of blood coagulation GO term. False discovery rate was calculated in PantherDB using functional enrichment analyzing all Biological Process GO Terms. (B) Pathway map of the extrinsic blood coagulation cascade (right) and the plasminogen activation system (left) with overlaid expression values. Blue asterisks indicate upregulation, black asterisks indicate no change, and red asterisks indicate down regulation.

