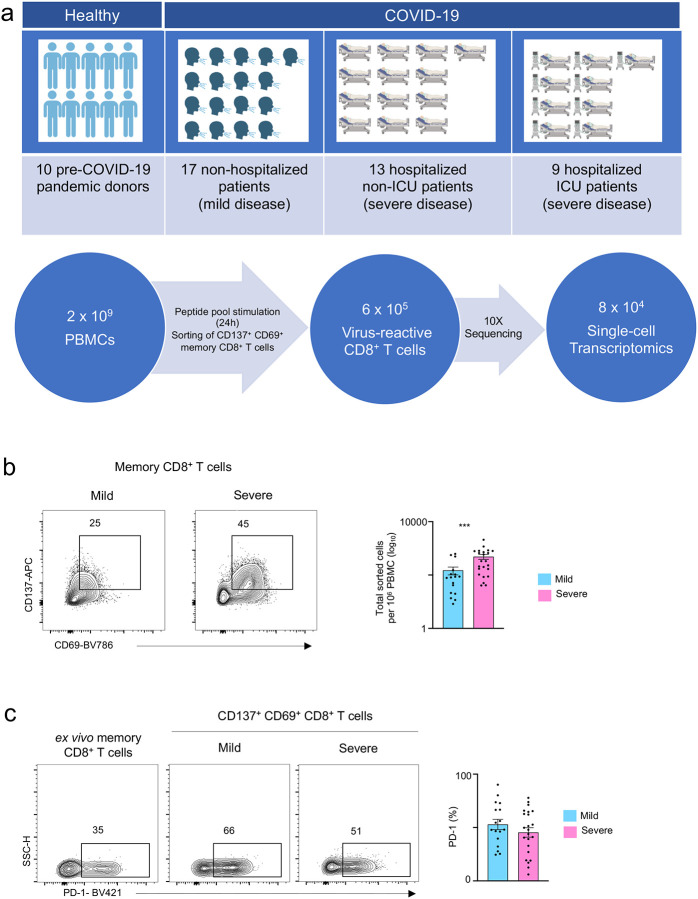
Figure 1. CD8+ T cell responses in COVID-19 illness.
a, Study design overview. b, Representative FACS plots displaying surface staining of CD137 and CD69 in post-enriched CD8+ memory T cells, stimulated for 24 hours with SARS-CoV-2 peptide pools, from COVID-19 patients with mild and severe illness (left), and summary of the number of cells sorted per million PBMC (right). c, Representative FACS plots (left) showing surface expression of PD-1 in CD8+ memory T cells ex vivo (without in vitro stimulation) and in CD137+ CD69+ CD8+ memory T cells following stimulation, post-enrichment (CD137-based) and corresponding summary plots (right) showing proportion of PD-1 expressing cells in each study subject (P = 0.26, unpaired t-test); Data are displayed as mean +/− S.E.M (N=39). ***P<0.001 by Mann-Whitney test (b).

