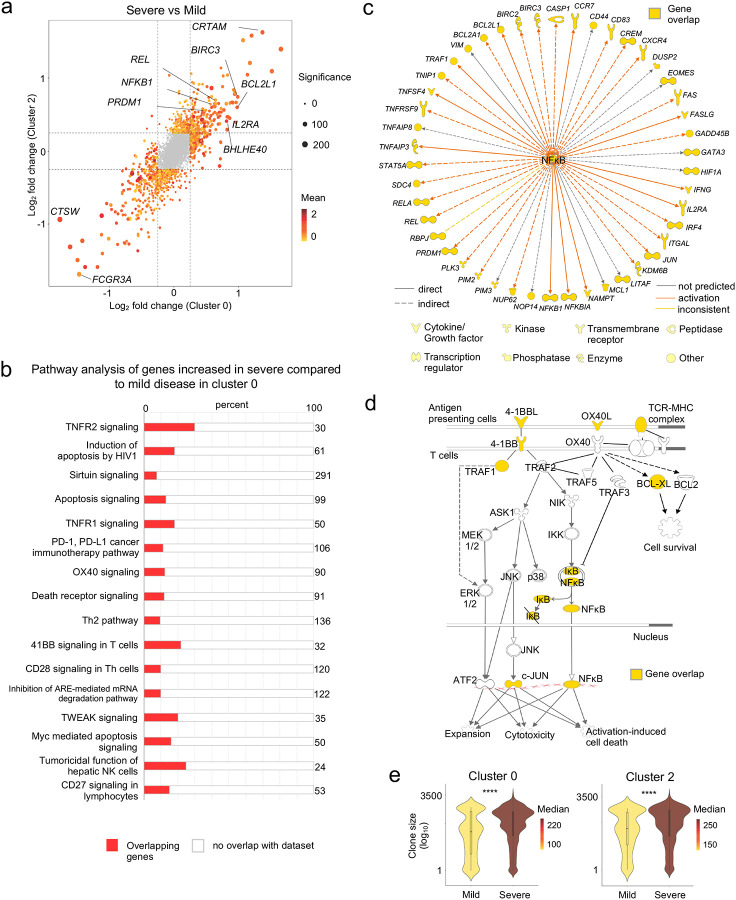
Figure 4. Pro-survival features in SARS-CoV-2-reactive CD8+ T cells from patients with severe COVID-19 illness.
a, Plot shows fold change values of differentially expressed genes (adjusted P < 0.05, mean CPM >0, log2 fold change >0.25) in cluster 0 (x-axis) and 2 (y-axis) when comparing COVID-19 patients with severe and mild illness. A positive value indicates that the particular gene has increased expression in patients with severe disease relative to patients with mild disease in a given cluster, while a negative value indicates the opposite. b-d, Ingenuity pathway analysis (IPA) of genes with increased expression (adjusted P <0.05, log2 fold change >0.25) in cluster 0 cells between COVID-19 patients with severe versus mild illness; b, Top 16 canonical pathways with significant enrichment; c, Upstream regulatory network analysis of genes in NF-κB pathway; d, Transcripts encoding components in the 4–1BB and OX40 signaling pathway. e, Violin plots showing the degree of CD8+ T cell-clonal expansion in cluster 0 and 2 between COVID-19 patients with mild and severe disease. **** P <0.0001 by Mann-Whitney test.

