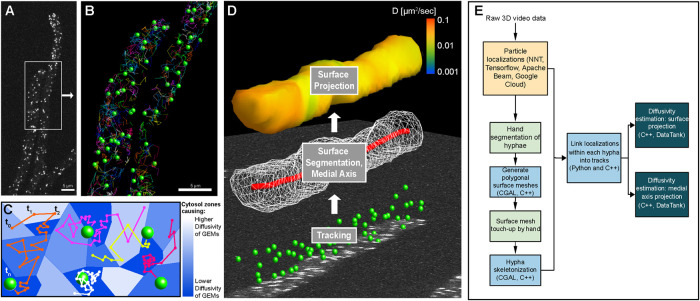
FIGURE 2:
Particle tracking and cellular geometry analysis pipeline. (A) A representative max projection of GEMs imaged within Ashbya. (B) Green spheres show location of GEMs from the region in A that were localized for this frame and linked to at least one other time point. Any GEMs visible in A that are not shown in B are likely due to an inability to link in time, rather than a missed localization. Multicolored lines show the tracks for the entirety of the video. (C) Schematic of a heterogeneous cytosol, where local material properties, and resultant diffusivity of GEMs, change throughout space as represented by the blue tessellation. Hypothetical GEMs tracks through time are shown as colored lines as in B. Due to the small 40 nm size of GEMs, they have high mobility and individual particles can explore a relatively large region of the cytosol over the course of 3D imaging. Due to this, we use only the frame-to-frame displacements of GEMs to create a map of spatially varying diffusivity within the cytosol. (D) A diagram representing the flow of the analysis pipeline, starting with particle tracking on image data (bottom panel, green spheres), followed by surface segmentation (middle panel, white wireframe of the polygonal surface mesh), and computation of the medial axis (red curve). A representative surface projection of diffusivity is shown for the final step (top panel, heat map). (E) A diagram showing the general organization and steps of the particle tracking analysis pipeline.

