FIGURE 4:
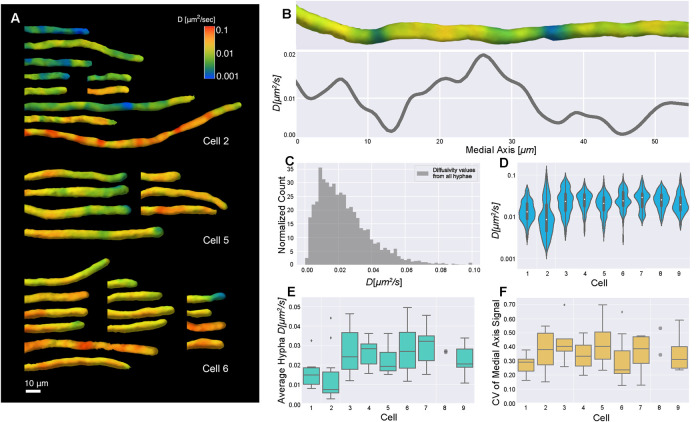
Diffusivity varies within hyphae and between cells. (A) Surface diffusivity projections from three cells in the analysis. Note that segmented hyphae were manually aligned for visualization. (B) Diffusivity surface projection (top) and corresponding medial axis projection (line plot) for a representative hypha. The surface projection and medial axis plot were lined up by matching the positions of the end points; however, as the surface projection is shown on the surface of a 3D shape and the medial axis plot contains averaged values along a line, they were impossible to perfectly match up. (C) Histogram of all medial axis diffusivity values from every hypha, normalized so the area of the histogram is 1 by dividing count/(number of observations * bin width) to get a probability density. Nine cells were imaged with 63 hyphae in total, each containing many nuclei and local environments. In a uninucleate context, this would be equivalent to hundreds to a thousand cells in terms of biomass per nucleus. Average diffusivity is 0.02 ± 0.02 (SD) μm2 s−1 and n = 8558 for medial axis diffusivity values from all hyphae, coming from a total 2148 μm of medial axis. The diffusivity value at each medial axis point comes from a cytosolic volume of 2 μm3 on average. Each diffusivity value is weighted by the volume that it was estimated from. (D) Violin plots show the log-scaled distribution of the medial axis diffusivity values from all hyphae for each cell, indicating overall cell–cell variability. When we compared these distributions to each other, about half were significantly different (see Table 1). The number of medial axis diffusivity values per cell ranges from 374 to 1702. (E) Box plots show the average of each hypha’s medial axis signal, indicating hypha-to-hypha variability of average diffusivity within each cell. Each cell had seven hyphae on average. Outliers are shown as diamonds. Any cell with less than five hyphae has all data points shown as gray circles. (F) Box plots show CV for each hypha’s medial axis signal. Each CV provides a measure of the variability of diffusivity along the medial axis in a given hypha.

