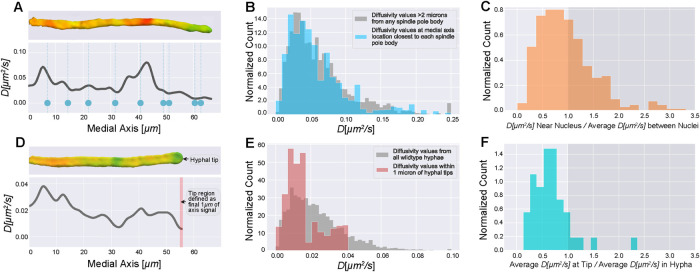
FIGURE 5:
Diffusivity estimates relative to cell landmarks. (A) Single hypha diffusivity surface projection and corresponding medial axis projection. Blue dots show medial axis locations of nuclei within the hypha. Nuclei were imaged first in a single z-stack, followed immediately by 3D imaging of GEMs; 353 nuclei were localized within 59 total hyphae from four cells by fluorescently tagging a component of the SPB. (B) Blue histogram shows diffusivity values near nuclei, as determined by mapping each SPB to its nearest medial axis point and extracting the diffusivity value there. The diffusivity value at each medial axis point comes from a cytosolic volume of 2 μm3 on average. Each diffusivity value is weighted by the volume that it was estimated from. The gray histogram shows medial axis diffusivity values that are more than 2 μm from any SPB. As nuclei are 2 μm in diameter on average, and we only have the SPB marked, these values give diffusivity in the regions between nuclei. Note that we observed a slightly higher range in estimated diffusivities in this strain compared with wild type. For the gray histogram, n = 4457 for medial axis diffusivity values more than 2 μm from any SPB, coming from a combined 1194 μm of medial axis. For the blue histogram, n = 353 medial axis values from nuclei locations. (C) For each of the 353 nuclei, we calculated the ratio of diffusivity near nuclei to average diffusivity of regions between nuclei. (D) Single hypha diffusivity surface projection and corresponding medial axis projection, with the red bar highlighting the tip region which we have defined to be the last 1 μm of the medial axis diffusivity curve. For these measurements, 41 hyphal tips were analyzed across nine cells from the large dataset used for analysis in Figure 4. (E) Diffusivity values from all hyphae compared with diffusivity values within the tip region. The gray histogram is from Figure 4C. For the red histogram, n = 226 medial axis diffusivity values from 41 tip regions. (F) For each of the 41 hypha with tips analyzed, we calculated the ratio of average diffusivity in the tip region to average hyphal diffusivity. All histograms normalized to have area of 1 by dividing count/(number of observations * bin width) to get a probability density.

