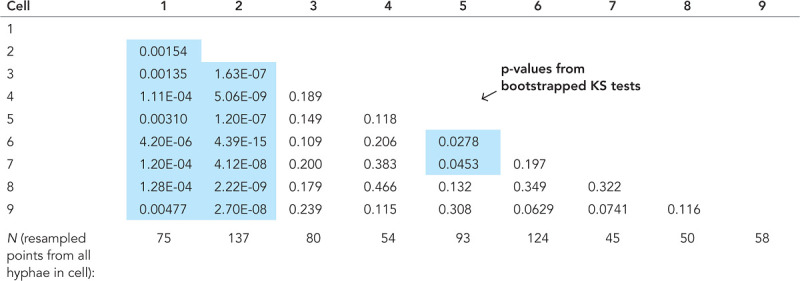
TABLE 1:
Statistics from Figure 4D.
 |
Statistics from Figure 4D. Matrix of p values from two-sample KS tests, with blue highlighting p < 0.05. As each GEM displacement substantially contributes to the surrounding 3 μm of medial axis due to the spatial averaging, the distributions of all medial axis points were resampled (with replacement) with N equal to the total length of cell’s medial axis/3 μm to ensure independent observations. Each cell’s resampled distribution was then compared with all other cells, and this process was repeated 1000 times to get an average p value.
