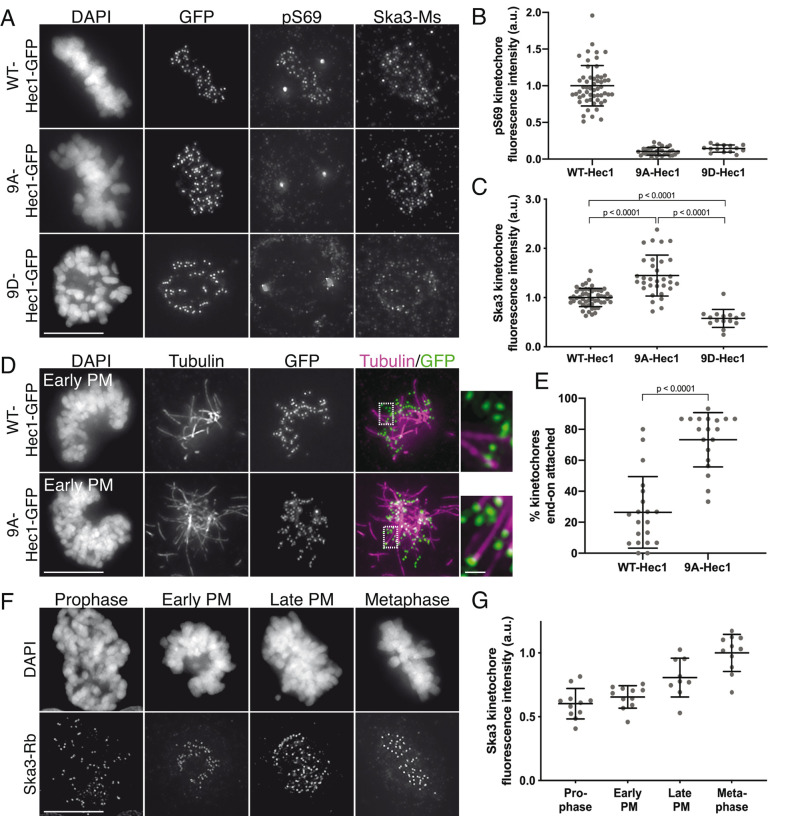
FIGURE 1:
Phosphorylation of the Hec1 tail domain affects kinetochore–microtubule attachment stability and Ska complex loading to kinetochores. (A) Immunofluorescence images of cells expressing WT-, 9A-, and 9D-Hec1-GFP. Cells were fixed and stained using antibodies to Hec1 pS69 and Ska3 (mouse). (B) Quantification of pS69 kinetochore fluorescence intensity from cells expressing WT-, 9A-, and 9D-Hec1-GFP. For each condition, at least 20 kinetochores per cell were measured from at least five cells per experiment from three separate experiments. (C) Quantification of Ska3 kinetochore fluorescence intensity from cells expressing WT-, 9A-, and 9D-Hec1-GFP. For each condition, at least 20 kinetochores per cell were measured from at least five cells per experiment from three separate experiments. Statistical significance was determined by a one-way analysis of variance (ANOVA). (D) Immunofluorescence images of cold-treated cells expressing WT- and 9A-Hec1-GFP. Cells were incubated in ice-cold DMEM for 12 min before fixation, permeabilized, fixed, and stained using antibodies to tubulin. Insets are enlargements of the region indicated by the dashed box. (E) Quantification of end-on attachment in cold-treated cells expressing WT- and 9A-Hec1-GFP. For each condition, at least 15 kinetochores per cell were measured from at least nine cells per experiment from two separate experiments. A Student’s t test was carried out to determine statistical significance. (F) Immunofluorescence images of untreated, control cells in different stages of mitosis fixed and stained with antibodies to Ska3 (rabbit). (G) Quantification of Ska3 kinetochore fluorescence intensity in control cells in progressive stages of mitosis. For each mitotic phase, at least 20 kinetochores were measured from at least four cells per experiment from two separate experiments. On all graphs, each dot represents the average value for all kinetochores from a single cell. Scale bars: 10 and 1 µm for panels and insets, respectively.

