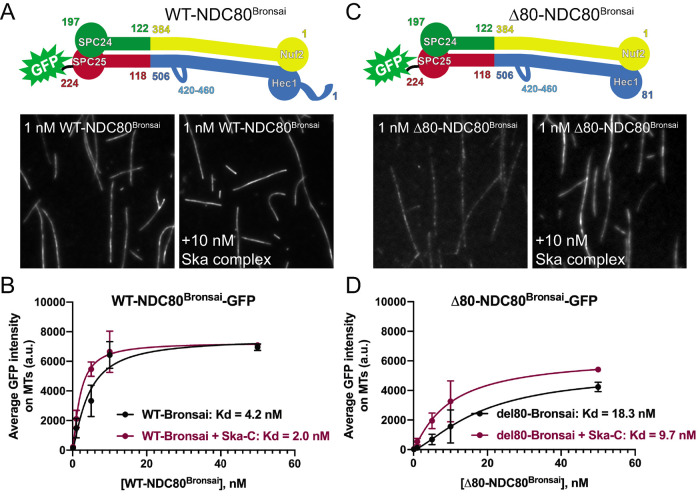
FIGURE 3:
The Hec1 tail domain is not required for Ska complex-mediated enhancement of NDC80 complex–microtubule binding. (A and C) Top: schematics of NDC80Bronsai complexes used in the TIRF-based microtubule binding experiments. Bottom: GFP fluorescence images of NDC80 complexes decorating microtubules in the presence and absence of Ska complex. All images show a single concentration of the NDC80 complex from the experiment (1 nM) with and without added Ska complex (10 nM). (B and D) Binding curves from the microtubule binding assays. Datapoints and curve fits shown in black are from experiments without added Ska complex. Those shown in burgundy are from experiments with added Ska complex. Each point on the curve represents the average fluorescence intensity from three separate experiments. At each concentration, GFP-NDC80 complex fluorescence intensity was measured from at least 40 individual microtubules from at least 10 different TIRF fields per experiment. Scale bars: 10 µm.

