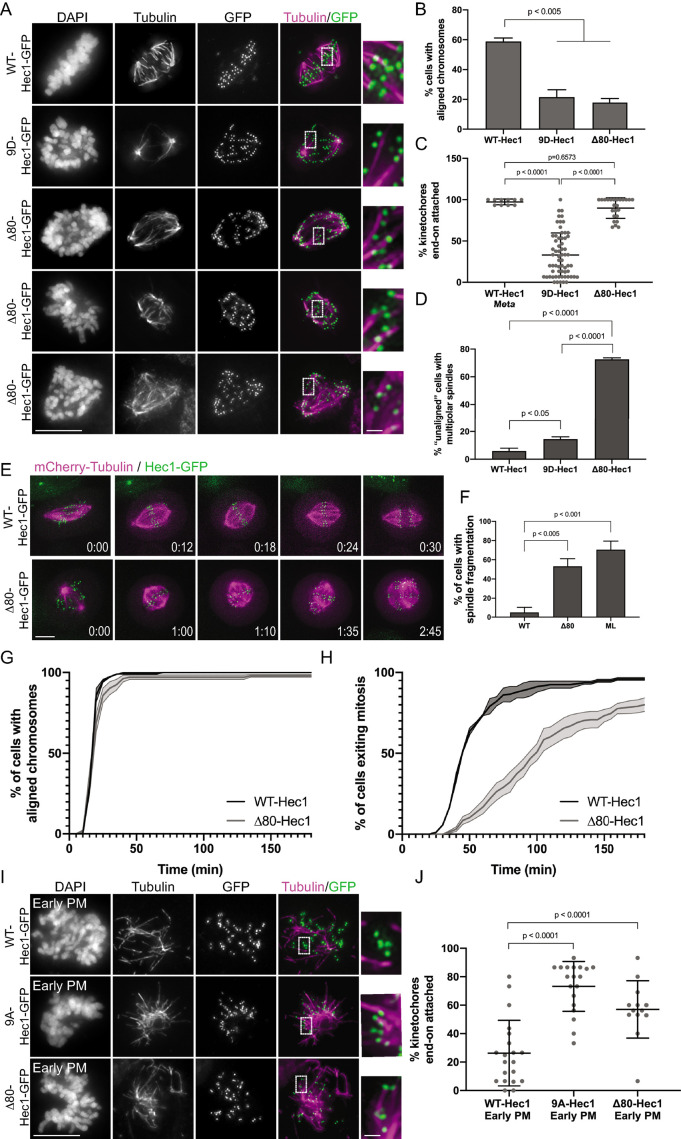
FIGURE 4:
The Hec1 tail domain is not required for the formation of stable end-on kinetochore–microtubule attachments in cells. (A) Immunofluorescence images of cold-treated cells expressing WT-, 9D-, and Δ80-Hec1-GFP. Cells were incubated in ice-cold DMEM for 12 min, permeabilized, fixed, and stained using antibodies to tubulin. Insets are enlargements of the regions indicated by the dashed boxes. Three examples of cells expressing Δ80-Hec1-GFP are shown. (B) Quantification of chromosome alignment in cells expressing WT-, 9D-, and Δ80-Hec1-GFP. For each condition, chromosome alignment was assessed in at least 100 cells per experiment from two separate experiments. Cells were scored as “aligned” if they had a metaphase plate with <5 chromosomes off the plate. Statistical significance was determined by a one-way ANOVA. (C) Quantification of end-on attachment in cells expressing WT-, 9D-, and Δ80-Hec1-GFP and cold-treated prior to fixation. For each condition, at least 15 kinetochores per cell were measured from at least 10 cells per experiment from two separate experiments. Statistical significance was determined by a one-way ANOVA. (D) Quantification of multipolarity observed in cells expressing WT-, 9D- and Δ80-Hec1-GFP. Cells with unaligned chromosomes were scored for containing bi- vs multipolar spindles, and the percent of cells with multipolar spindles is shown. For each condition, at least 100 cells per experiment were analyzed from two separate experiments. Statistical significance was determined by a one-way ANOVA. (E) Still images from time-lapse experiments of cells expressing Hec1-GFP and mCherry-tubulin. Time from nuclear envelope breakdown (NEBD) is denoted on bottom right corner of each image (hours:minutes). (F) Quantification of spindle pole fragmentation frequency quantified from time-lapse imaging experiments. Cells were scored as undergoing fragmentation events if loss of spindle bipolarity was observed during time-lapse imaging as determined from the mCherry-tubulin signal. Quantifications shown are averages from two (WT-, ML-) or four (Δ80-Hec1) independent experiments. Statistical significance was determined by a one-way ANOVA. (G) Quantification of chromosome alignment efficiency in cells from the experiment shown in panel E. Cell fate was tracked after mitotic entry (as determined by NEBD) for 3 h, and cells were scored as “aligned” upon metaphase plate formation (as determined by Hec1-GFP fluorescence). Data for WT- and Δ80-Hec1 are from 175 cells from two independent experiments and 165 cells from four independent experiments, respectively. (H) Quantification of mitotic exit timing in cells from the experiment shown in panel E. Cell fate was tracked after mitotic entry (as determined by NEBD) for 3 h, and cells were scored as “exiting mitosis” upon anaphase entry. Data for WT- and Δ80-Hec1 are from 175 cells from two independent experiments and 165 cells from four independent experiments, respectively. (I) Immunofluorescence images of cold-treated, early prometaphase cells expressing WT, 9A-, and Δ80-Hec1-GFP. Cells were incubated in ice-cold DMEM for 12 min, permeabilized, fixed, and stained with antibodies to tubulin. Insets are enlargements of the regions indicated by the dashed boxes. (J) Quantification of end-on attachment in early prometaphase cells expressing WT-, 9A-, and Δ80- Hec1-GFP. The WT- and 9A-Hec1 data shown are from the experiment presented in Figure 2. For each condition, at least 15 kinetochores per cell were measured from at least six cells per experiment from at least two separate experiments. Statistical significance was determined by a one-way ANOVA. On all dot plots, each dot represents the average value for all kinetochores from a single cell. Scale bars: 10 and 1 µm for panels and insets, respectively.

