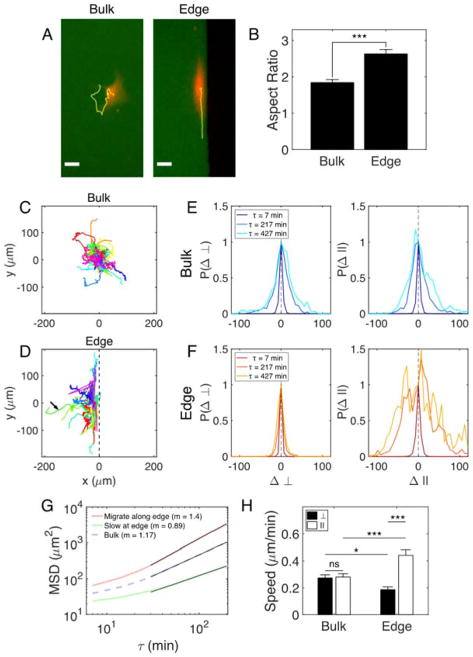
Figure 1. Edges induce elongation and enhance migration of isolated MEFs.
(A) MEFs expressing mCherry (red) cultured on microcontact-printed islands of FN (green). Yellow lines indicate trajectories of the cell centers over ~6 hr. Scale bars are 30 μm. (B) Aspect ratio of ellipses fit to cytoplasmic mCherry signals. Trajectories of mCherry-infected MEFs in the bulk (C) and at edges (D) of FN islands. Longest duration = 14 hr. Arrow indicates a cell that left the edge. 44 cells analysed in each environment. Normalized probability distributions for displacements of cells in the bulk (E) and cells that migrate along edges (F) for three lag times, τ. □, direction perpendicular to edge; ||, direction parallel to edge. (G) Mean square displacement (MSD) plots for cells that migrate along edges, cells that remain nearly stationary at edges, and cells in the bulk. Log-log slopes (m) for the fit lines (black) are reported. (H) Speed of mCherry-infected MEFs in the bulk and migrating along edges. Values are mean ± SEM.

