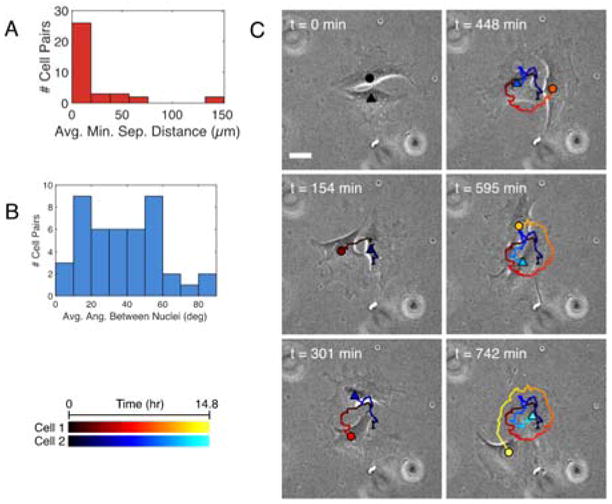
Figure 2. Cells in pairs only transiently co-align.

(A) Mean minimum separation distance of cytoplasmic mCherry signals of cells in pairs. 36 pairs analyzed in two independent experiments. (B) Mean angle between the orientations of the long axes of NucBlue-stained nuclei. 44 pairs analyzed in two independent experiments. (C) Three frames of a phase-contrast movie showing the morphology of two cells migrating around each other. Cell 1: circle in warm colors. Cell 2: triangle in cool colors. Gradient from dark to light shades indicates cell position over time (see scale in bottom left).
