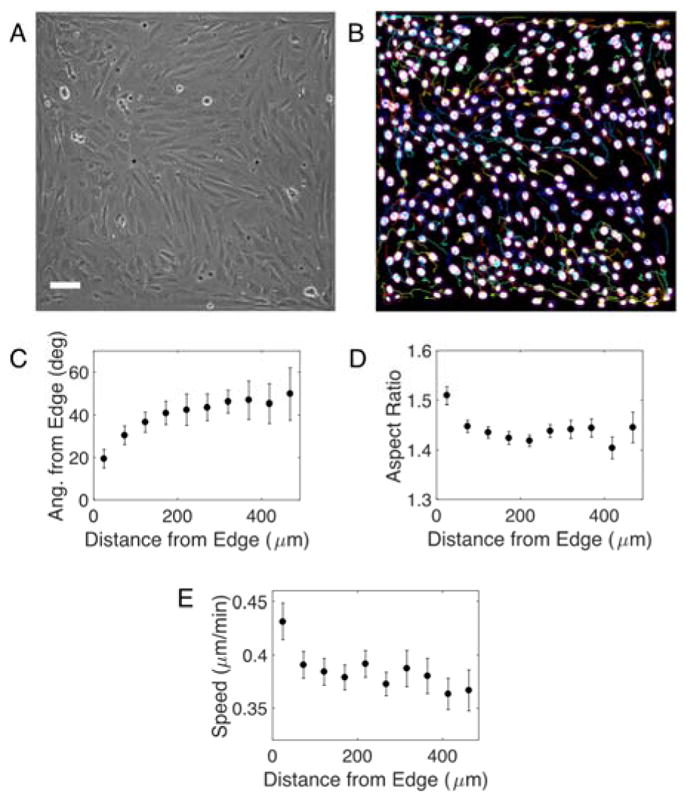
Figure 3. Edges influence morphology and migration of nearby cells in confluent monolayers.

(A) Phase contrast image of a nematic monolayer on a 1 mm × 1 mm FN island. Edges of the image are edges of the island. Scale bar is 100 μm. (B) Binarized image of nuclei of cells in A stained with NucBlue. Colored lines indicate trajectories of each nuclei over 6 hr. (C) Angle of nuclei relative to the nearest edge vs. distance to that edge. Aspect ratio (D) and speed (E) of nuclei vs. distance from nearest edge. 20 squares analyzed in two independent experiments. Mean ± SEM.
