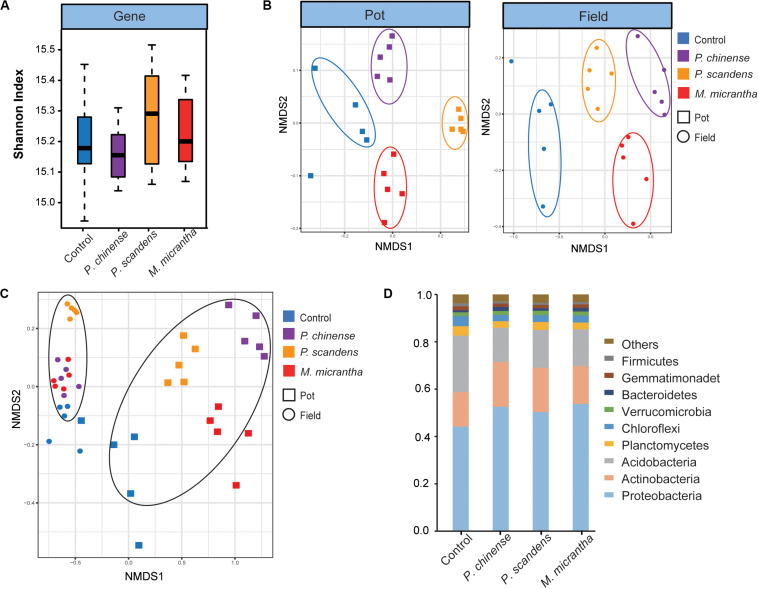
FIGURE 1.
Microbial structure in the rhizosphere of Mikania micrantha (M. micrantha), Polygonum chinense (P. chinense), and Paederia scandens (P. scandens), and control (bulk) soil. (A) Comparison of the microbial diversity at the gene level. (B) The non-metric multidimensional scaling (NMDS) plot of microbial communities at both pot experiment and invaded site. The analysis was based on Bray–Curtis dissimilarities at the gene level. (C) The NMDS plot of microbial communities in all samples, based on Bray–Curtis dissimilarities at the gene level. (D) Relative abundances at the phylum level.

