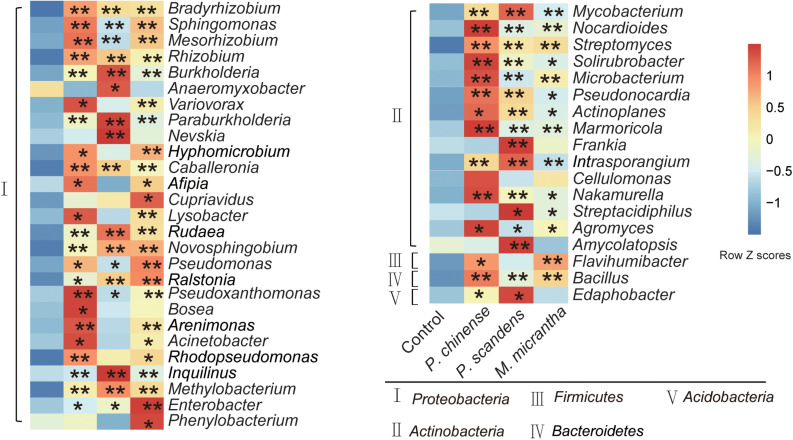
FIGURE 2.
Comparison of average relative abundance at the genus level in rhizospheres of M. micrantha and two native plants. The relative abundance of each genus was colored according to the row z score ((value - row mean)/row standard deviation). The comparisons of microbes in plant rhizospheres and control soil were compared by the Kruskal–Wallis test with Dunn’s multiple comparison test (*P < 0.05 and **P < 0.01).

