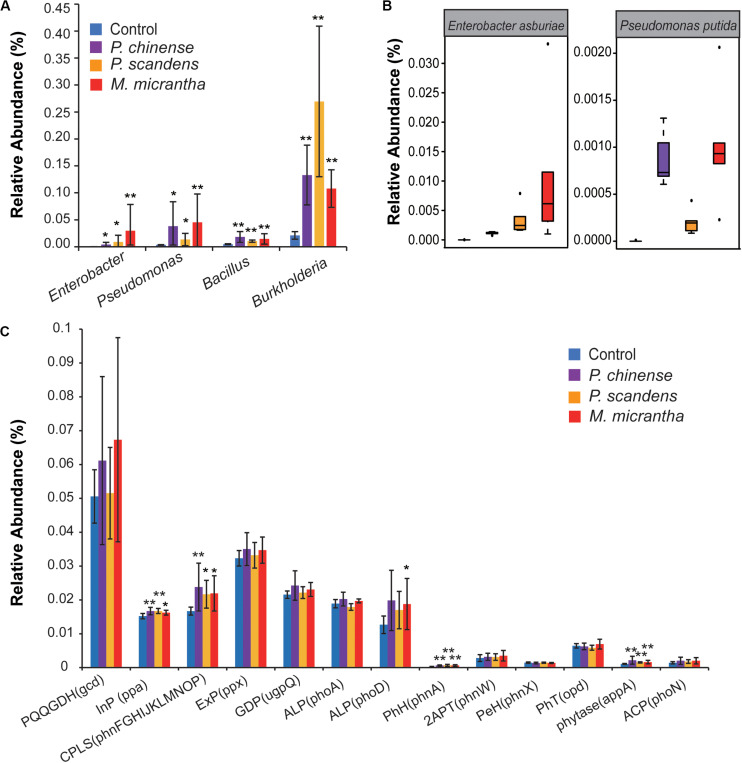
FIGURE 3.
Enhanced soil-borne available P in the rhizosphere of M. micrantha and two native plants. (A) The relative abundance of phosphate bacteria. (B) The relative abundance of Enterobacter asburiae and Pseudomonas putida. On each boxplot, the central mark indicates the median, the bottom and top edges of the box indicate the interquartile range (IQR), and the whiskers represent the maximum and minimum data points. (C) The relative abundance of genes coding for P solubilization and P mineralization. PQQGDH, quinoprotein glucose dehydrogenase; InP, inorganic pyrophosphatase; CPLS, C-P lyase subunit; ExP, exopolyphosphatase; GDP, glycerophosphoryl diester phosphodiesterase; ALP, alkaline phosphatase; PhH, phosphonoacetate hydrolase; 2APT, 2-aminoethylphosphonate-pyruvate transaminase; PeH, phosphonoacetaldehyde hydrolase; PhT, phosphotriesterase; ACP, acid phosphatase. The C-P lyase subunit was calculated as the total abundances of gene phnF, phnG, phnH, phnI, phnJ, phnK, phnL, phnM, phnN, phnO, and phnP. Error bars indicate average value ± SEM of indicated replicates. The pairwise comparisons of rhizosphere in each plant and control soil were used by the Kruskal–Wallis test with Dunn’s multiple comparison test (*P < 0.05 and **P < 0.01).

