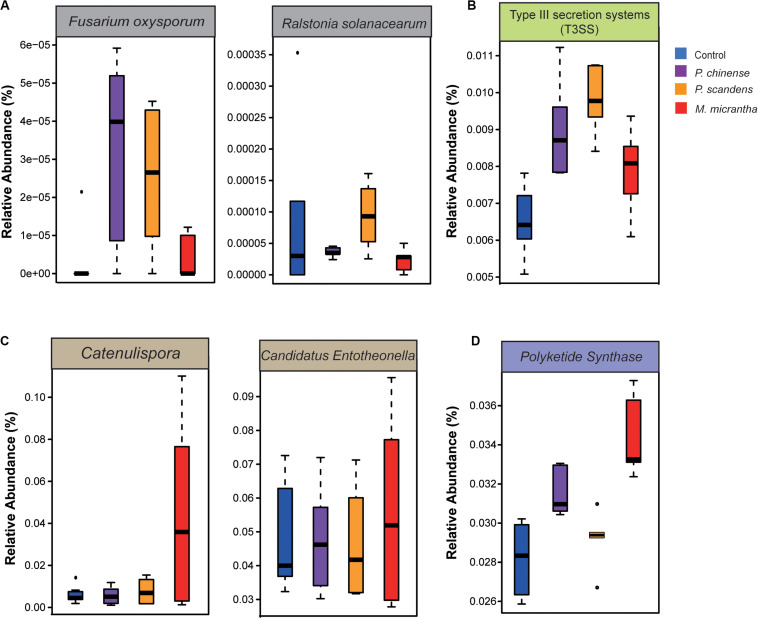
FIGURE 4.
Fewer pathogens and more biocontrol bacteria in M. micrantha rhizosphere. (A) The relative abundance of pathogens of Fusarium oxysporum and Ralstonia solanacearum. (B) The relative abundance of pathogenic genes of type III secretion systems (T3SS). (C) The relative abundance of biocontrol bacteria of Catenulispora and Candidatus Entotheonella. (D) The relative abundance of genes coding for type II polyketide synthase (PKS). On each boxplot, the central line indicates the median, the bottom and top edges of the box indicate the interquartile range (IQR), and the whiskers represent the maximum and minimum data points.

