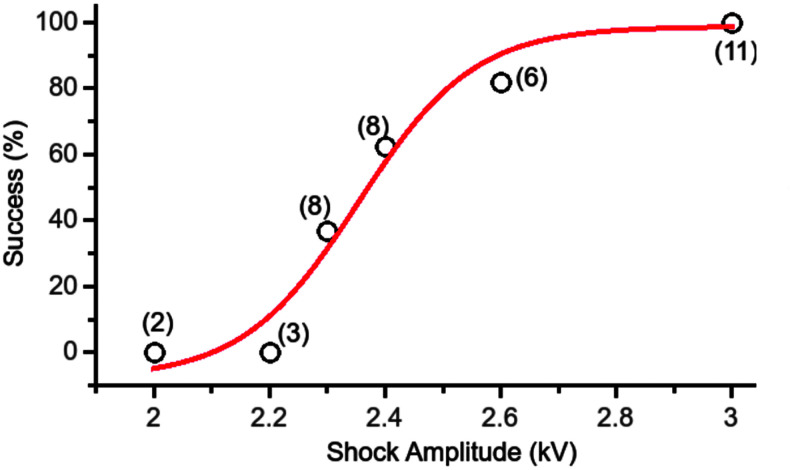
FIG. 2.
Defibrillation success rate as a function of shock amplitude for single 300 ns shocks. The number of observations contributing to each data point is shown in parentheses. The red line is a sigmoidal curve fitted to the data. Reproduced from Varghese et al.29 courtesy of Springer.

