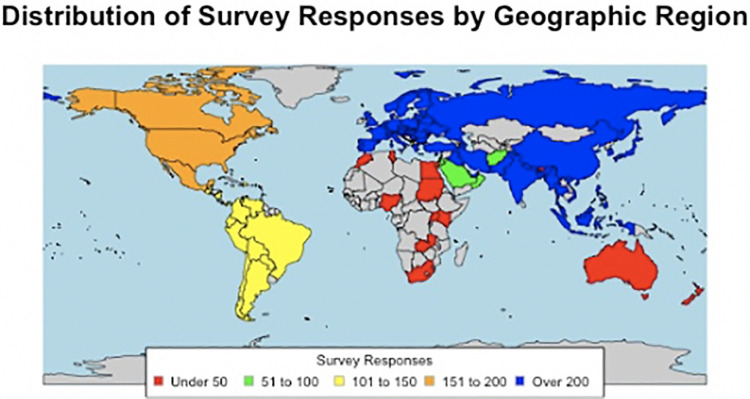
Figure 1.
Distribution of survey responses by geographic region; world map depicting number of survey responses received internationally. Color-filled countries indicate that at least 1 survey was received from that geographic region. Red, <50 surveys received; green, 51 to 100; yellow, 101 to 150; orange, 151 to 200; blue, >200; gray, no surveys received.

